by Scott Krisiloff, Avondale Asset Management
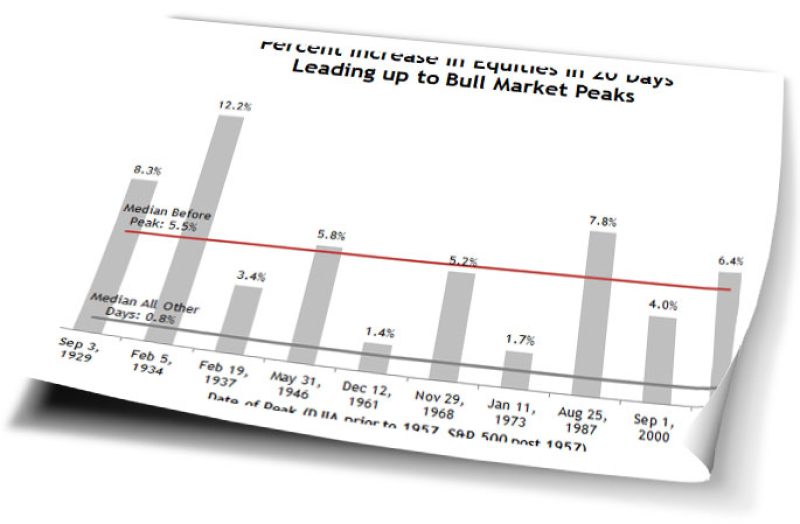
As shown in the chart below, bull markets tend to end with a crescendo of buying. The chart highlights the percent change in the $SPX or $DJIA in the final 20 trading days leading up to bull market peaks.
In the 10 bull markets post World War I, the final days of a bull have seen relatively large increases in equity indexes. The median change in the index in the 20 trading days prior to the peak is 5.5%. That’s considerably higher than the 0.8% median 20 day change on all other days.
Needless to say, there are plenty of occurrences in which the indexes are up this much over a 20 day period without signalling a bull market peak, so apply this data with care. However, it’s worth keeping this history in mind as something to be on the lookout for at a turning point.
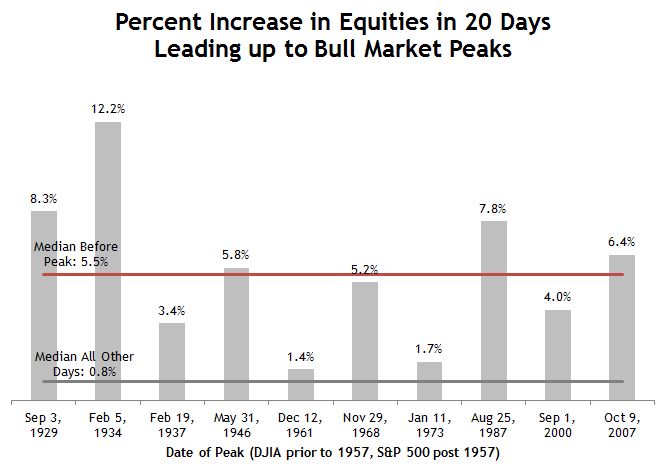
Source: Avondale
The information in this blog post represents my own opinions and does not contain a recommendation for any particular security or investment. I or my affiliates may hold positions or other interests in securities mentioned in the Blog, please see my Disclaimer page for my full disclaimer.