“Huey Lewis and the News!”
by Jeffrey Saut, Raymond James
October 14, 2013
The object lesson here is an old one. Throughout the 80 year history of the Lowry Analysis, it has always been difficult for investors to produce consistent portfolio profits by trying to buy or sell stocks based on the news of the moment -- the same news every other investor knows. The better course of action for investors is to always stay focused on measurements of the forces of Supply and Demand, and to structure portfolios in accordance with the dominant trends of the market. Short term considerations – with our short term indicators at oversold levels, a buy-signal intended for aggressive traders was triggered on Thursday, Oct 10th, when the 14-day Stochastic rose back above its moving average. And, a conventional short term buy-signal was also registered on Thursday when the 90% Upside Day caused our Short Term Index to rise a total of 6 points from its recent low.
... Lowry’s Weekend report
Thirty years ago Huey Lewis and the News released their smash hit album titled Sports. It was an instant hit with every song on the album a winner. And last week Huey was playing on the Street of Dreams as participants danced to his hit tune “This Is It.” Of course, the “It” in question is a potential deal between the House of Representatives and the President on the debt ceiling and the government shutdown. Readers of these missives know this is what always happens with such stand-offs, which would be a deal arriving at the last minute, just like what occurred with the “fiscal cliff.” That sputnik moment fostered back-to-back 90% Upside Days, meaning 90% of total Upside/Downside points and volume traded on those days was recorded on the upside. Those two sessions were 12/31/12 and 1/2/13, and that same week I noted that since 1950 such back-to-back Upside Days have seen the S&P 500 (SPX/1703.20) better by 6.1% one month later (83% of the time) and up 12.8% higher three months later (100% of the time). This year we did not quite make the three-month 12.8% returns, but we certainly came close. Interestingly, one year later, back-to-back 90% Upside Days has seen the SPX up 18.9% nearly 100% of the time.
Obviously, we will have to wait until January to see how that one plays, yet it is pretty interesting that is about how much the SPX is up year to date. I mention this 90% Upside Day indicator this morning because October 10th was the first 90% Upside Day since the beginning of the year, and while Friday failed to qualify as another 90% Upside Day, it clearly was a step in the right direction.
On last week’s 90% Upside Day, I received a number of emails and phone calls asking if short covering amplified Thursday’s Triumph of some 323 Dow points. I responded, “I am sure it added to the intensity of the rally.” Early the next morning I was talking to a portfolio manager in London who asked me if I had heard about a large prime brokerage firm being closed down by the U.K. regulators on October 14th. A prime broker, for those who are not stock market professionals, is defined by Wikipedia as:
Prime brokerage is the generic name for a bundled package of services offered by investment banking firms to hedge funds and other professional investors needing the ability to borrow securities and cash to be able to invest on a netted basis and achieve an absolute return. The prime broker provides a centralized securities clearing facility for the hedge fund so the hedge fund's collateral requirements are netted across all deals handled by the prime broker.
And in this case “the hedge fund’s collateral requirements” is the operative phrase because said closing prime broker was giving its clients 10-to-1 leverage. That would be for every $1,000,000 a hedge fund had they could buy (or short) $10,000,000 worth of stock. Accordingly, many hedge funds began scrambling last week to find another prime broker willing to give them 10-to-1 leverage. Since it is doubtful they will be able to secure such leverage again, those positions should have to be squared. If you are “short,” and using 10:1 leverage, that means you probably had to “buy in” most of those short positions. So yes, short-covering played a role in last Thursday’s romp.
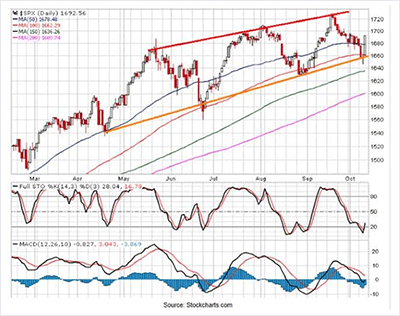
Comes Friday, and the equity markets really needed to build on Thursday’s rally, and after a shaky start stocks did just that. However, at 20% the Buying Pressure Index was a mere shadow of Thursday’s +93% reading. Nevertheless, a short-term “buy signal” was triggered when the 14-day Stochastic traveled above its moving average and the short-term trading index rose 6 points. Last week also saw my proprietary trading index touch an extreme downside band at 1646, where it was red in color, and then turned green at the extreme upside trading band of 1704. For such an event to occur, within a single week, is a pretty rare event. Also rare was this insight from Jason Goepfert’s invaluable SentimenTrader organization:
There have been 7 other times in the history of the S&P 500 tracking fund, SPY, that it hit a multi-week low, then gapped up the next morning at least 1%, then followed through with those gains the next day (when above the 200-day moving average). Each of them led to further gains in the next three weeks, averaging +3.5%, though the risk/reward was less positively skewed than ideal, as conditions were sometimes volatile.
So the upside should be favored here, although it should be favored with a cautionary tone because of the day-over-day drop-off in the Buying Pressure Index.
As for stocks for your potential buy list, these are favorably rated by our fundamental analysts and screen well by my proprietary indicators: Apache (APA/$87.95/ Outperform); Aflac (AFL/$64.48/Outperform); National Oilwell (NOV/$79.32/Outperform); NVIDIA (NVDA/$15.26/Strong Buy); and Jabil Circuit (JBL/$21.99/Strong Buy).
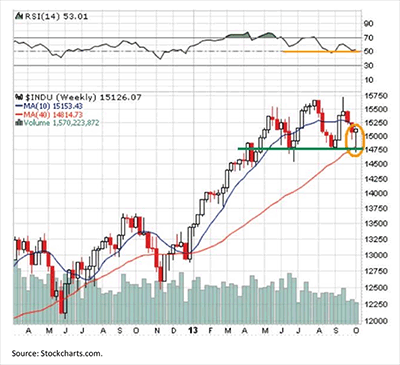
The call for this week: Having lived inside the D.C. Beltway, I know how the Washington Waltz plays and therefore have been adamant about a deal being in the works. Indeed, over the past two weeks I have spent time inside the Beltway and my conclusion remains the same. Plainly, I do not think it is different this time, and neither does the stock market; a deal will be done. Last week the Dow Industrials halted their decline around the 100-day moving average (1662) on a closing basis, a feat that has been repeated numerous times over the past few years. Interestingly, on their upside reversal day (last Wednesday) the Dow Industrial formed a bullish “hammer” pattern in the candlestick charts (see the orange circle in the attendant chart). As it did last year, and again this year, the 100-DMA has tended to contain any decline. This morning, however, the “now you see it, now you don’t” debt ceiling deal is in “now you don’t” mode, leaving the preopening SPX futures down 12 points, which brings back into play my often mentioned 1684 “pivot point.” Obviously, what happens inside the Beltway this week will determine the near-term direction for the stock market. I continue to believe a deal will evolve and the equity markets will then focus on the good things that are happening.
Copyright © Raymond James


