For this week's SIA Equity Leaders Weekly, we are going to take a look at a couple of trading commodities that have been on a run over the past month, Gold and Copper. As readers of the ELW are aware both of these hard assets had declined dramatically over 2013 and had either reached key support in the case of Gold or breached key support in the case of Copper. This update will get us up to speed on their current technical attributes and what is needed from each to keep their rallies alive.
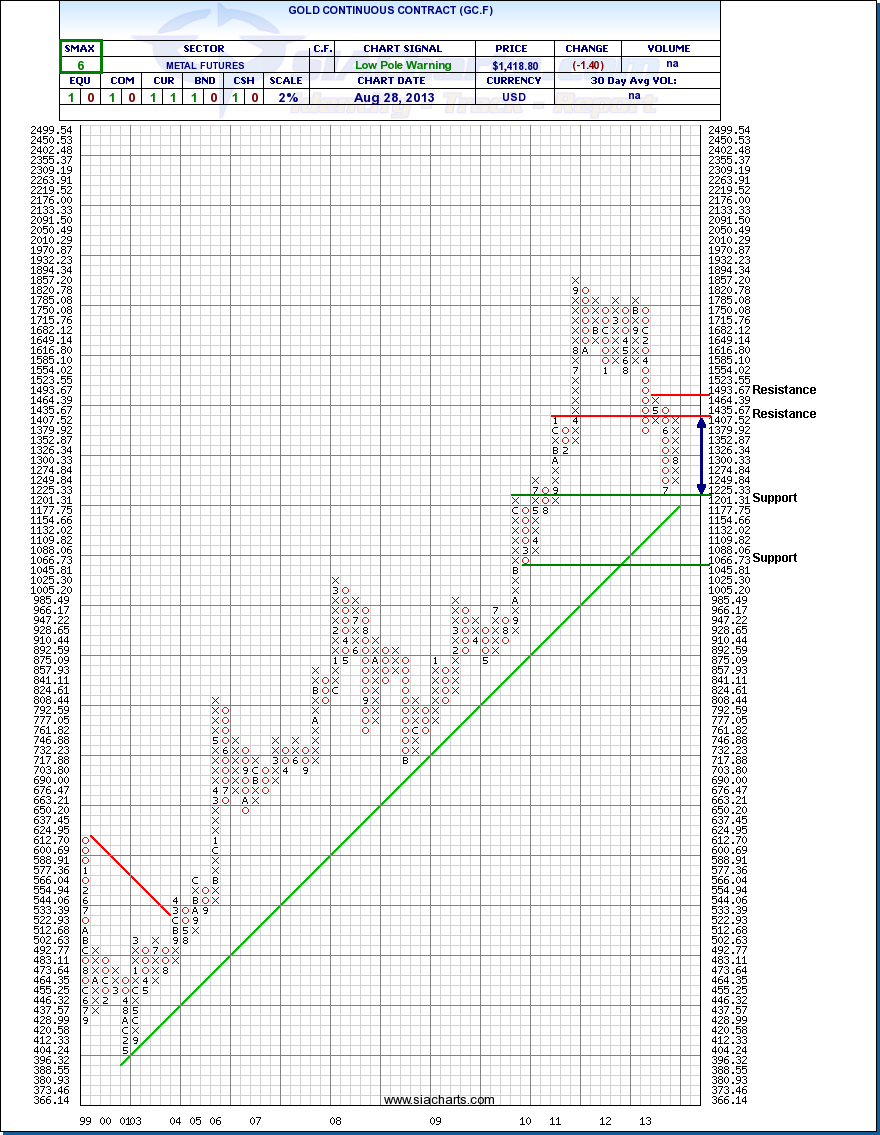
Gold Continuous Contract (GC.F)
In our first chart today we will take a look at Gold Bullion. As we can see in the chart, Gold had been on a steep decline from April to July of this year and moved down within striking range of its uptrend line, which was key support above $1,177.75. Since moving to just above this important technical point Gold has rallied back strongly taking out resistance at $1,352. Gold is now faced with a couple key resistance levels that need to be taken out to keep its rally alive, $1,435.67 and $1,493.67. Should it take out the second level it would be the first higher column of X's for Gold since September of 2011.
Overall, the current situation for Gold remains a technical bounce off extremely oversold conditions. As noted above, if the next two resistance levels can be taken out, this could change the intermediate term picture for Gold to a more bullish stance. We do though, have to be aware that Commodities remain an UnFavored Asset Class and that suggests the test ahead for Gold could be that much tougher.
Click on Image to Enlarge
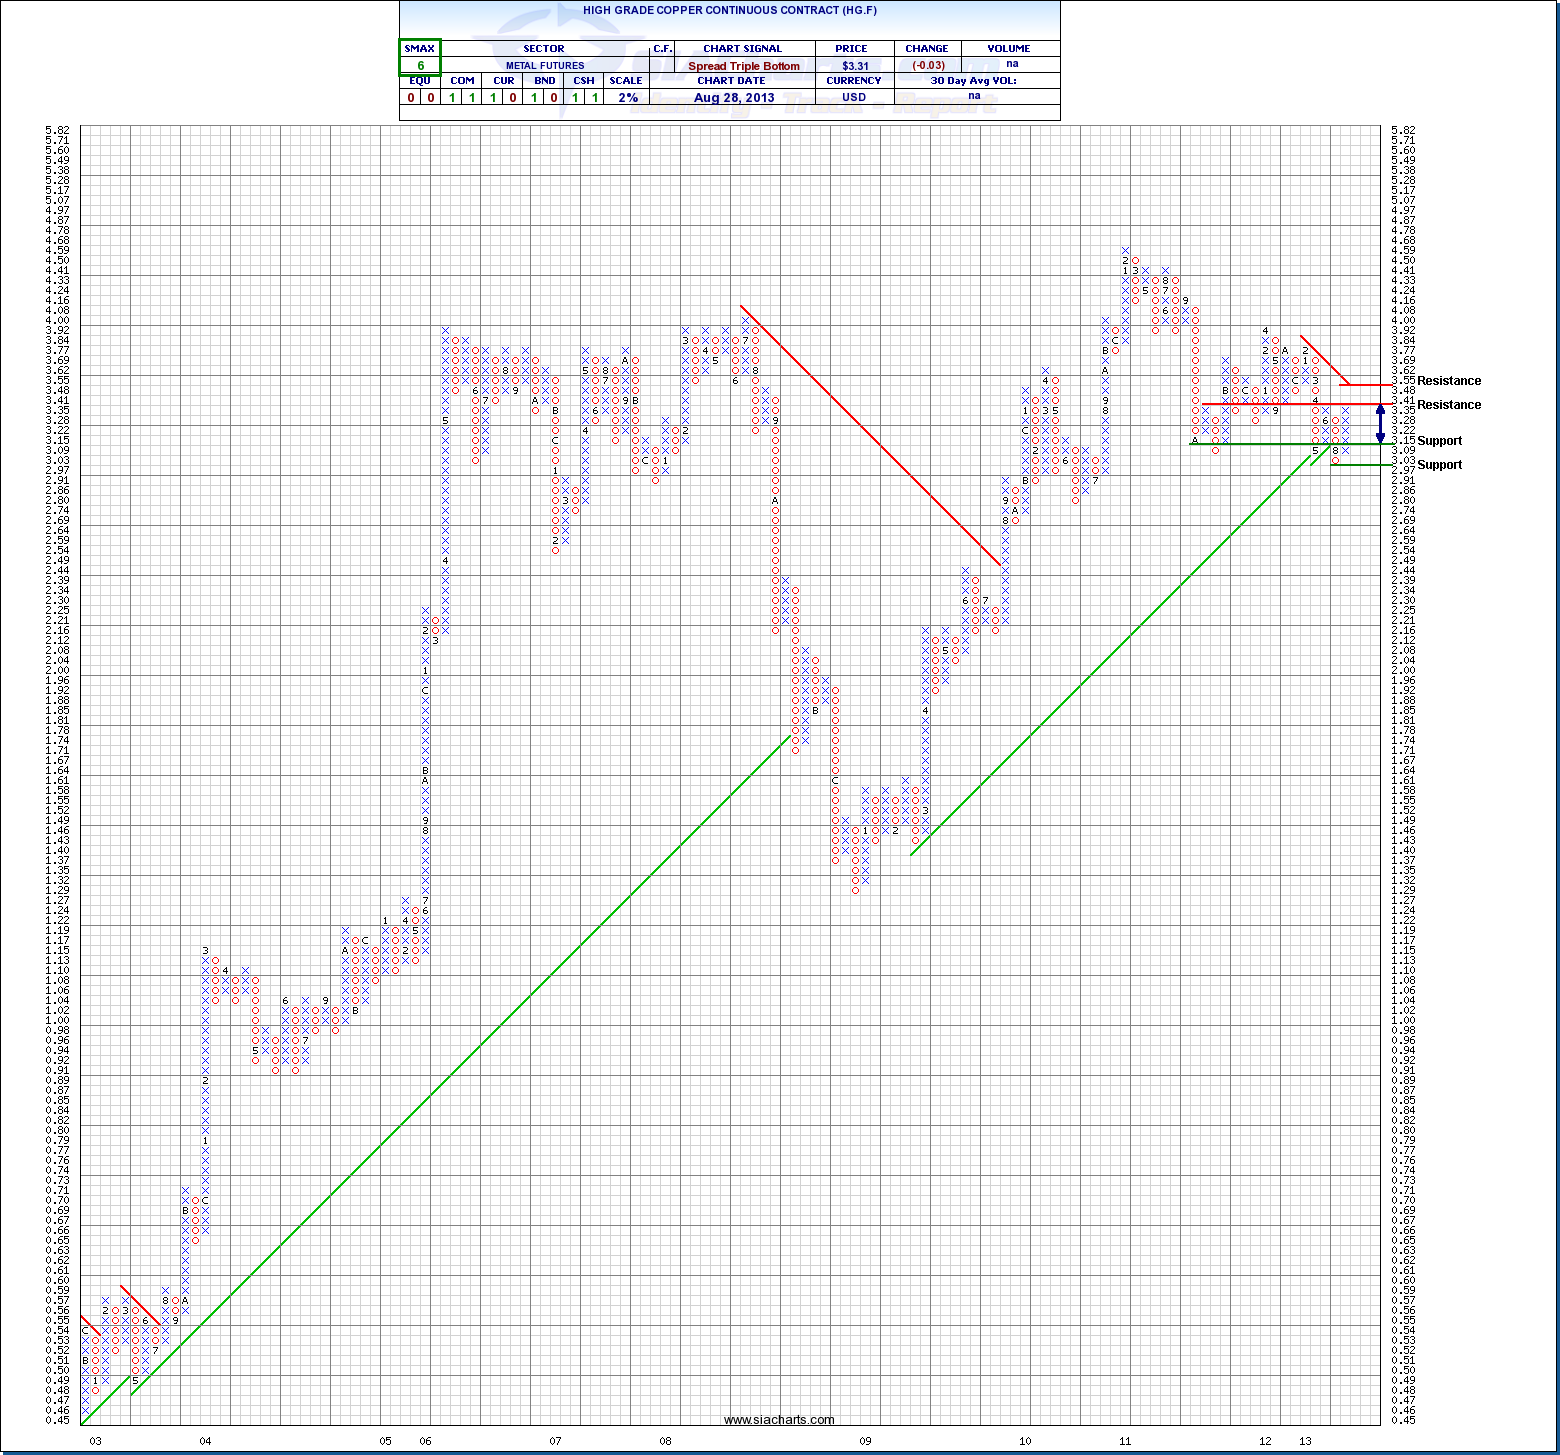
High Grade Copper Continuous Contract (HG.F)
Our second chart this week is commodity price activity on High Grade Copper. As we noted in our July 11th ELW, Copper had moved below its uptrend line in early July. Like Gold though, Copper has seen a surge of late, taking out resistance at the $3.28 level and now moving up to challenge its next two tests at $3.41 and more importantly the downtrend line at $3.55. Also like Gold, to keep the recent rally alive these technical resistance points have additional value given the weaker nature of Commodities on an intermediate basis.
The importance of the two charts highlighted here this week cannot be understated. First, the addition of many underlying metals stocks to the Favored zones of SIA Reports and the need for these two Commodities to follow through to keep those rallies going. Secondly, the weakness in the Commodity Asset Class remains in spite of the recent bullish moves in these two key names. If Commodities are to move from the bottom of the SIA Asset Class Ranking, the resistance levels shown in these two charts will need to be taken out.
Click on Image to Enlarge
SIACharts.com specifically represents that it does not give investment advice or advocate the purchase or sale of any security or investment. None of the information contained in this website or document constitutes an offer to sell or the solicitation of an offer to buy any security or other investment or an offer to provide investment services of any kind. Neither SIACharts.com (FundCharts Inc.) nor its third party content providers shall be liable for any errors, inaccuracies or delays in content, or for any actions taken in reliance thereon.
Copyright © SIACharts.com