by Sober Look
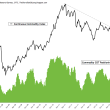
ETF Trends recently published an article called "Treasury ETFs: The Ultimate Contrarian Trade" (here). It seems that from the near-term technical perspective, treasury yields may have peaked. That is certainly possible, as portfolio managers - including some sovereign funds and other foreign institutions - have been indiscriminately dumping US government paper each time they hear the word "taper". One can even see the public's strong focus on the topic: the search frequency for the term "tapering" on Google has spiked to record levels (chart below). Furthermore, as the article points out, only "23% of investors are bullish on bonds" - the lowest level since early 2011. This has the makings of a contrarian indicator.
Source: Google Trends
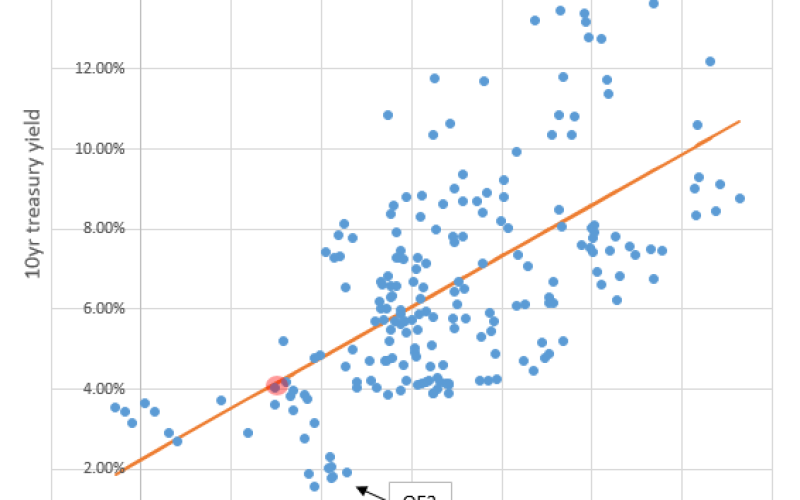
But what about the fundamentals? Where should the 10yr yield be if for example Goldman's recent forecast (see post) of roughly 3% nominal GDP (1.8% real) for Q3 persists for much longer? - not an unrealistic scenario. It turns out there is a long-term relationship between treasury yields and preceding GDP growth. The correlation is not that strong (r^2 =0.4), but thankfully this is a blog post instead of an academic publication.
The quarterly data is from 1962 to today and the points in the negative GDP territory are from the Great Recession. One can see that the Fed (as well as the Eurozone crisis to some extent) had recently pulled the yields down from the more "natural" level. Based on this fit, the 10y treasury should be yielding about 4%. This was roughly the situation during the recovery from the 2001 recession - a 3% trailing nominal GDP and a 4% treasury yield. It tells us that based on long-term history and without the Fed's interference, we could easily go up another 100bp on the 10yr - in spite of tepid GDP growth.
The Fed however will be in play for some time, even as it slows the pace of purchases. It is therefore possible that the oversold technical indicators described by ETF Trends may indeed be valid in the near-term - at least while the Fed continues to apply downward pressure on yields - and growth remains subdued. We could stay just above the "QE3 cluster" on the scatter plot.
ETF Trends: - “This isn’t to say Treasury yields will nearly undo their entire surge this year or that they won’t eventually climb above 3% in response to expectations of a less-generous Fed or a pickup in economic growth,” [Michael Santoli] notes. “But for now, the yield advance has arguably overshot, and the sectors pummeled as a result have suffered from investors planning for a rapid and relentless climb in rates that isn’t likely to happen.”
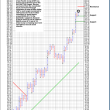
A pullback in 10-year Treasury yields here also makes sense from a technical perspective. Chris Kimble at Kimble Charting Solutions points out that the rally has lifted the 10-year yield to the top of its long-term channel resistance, while momentum is the most overbought [on yield basis, oversold on price basis] in seven years.
Copyright © SoberLook.com


