China’s elevated and rising debt levels appear to be one of the largest risks to the global economy today. Although it is difficult to gauge when the risks in that country could manifest as a crisis, investors should act with the knowledge that the margin of safety in the global investment environment continues to decrease.
by Scott Minerd, CIO, Guggenheim Partners
The massive build up of leverage in the Chinese financial system continues to represent one of the greatest risks to the world economy, with some estimates putting total Chinese debt at over 200 percent of GDP. China now represents 16 percent of global GDP, and contributed approximately 30 percent of the increase in global GDP in 2012. A crisis in its financial system could have damaging effects on global output and particularly on countries such as Singapore, South Korea, and Australia, which have large export exposure to China. The higher China’s debt levels climb, and the longer the country’s other structural economic issues -- such as a consumption/investment imbalance, and an overheating property market -- remain unresolved, the more severe the fallout will be should a credit crisis occur.
Trying to predict when persistent structural problems, such as those facing China, will lead to a shock for markets is extremely difficult. The evolution toward a breaking point can take months or years, and equally challenging is predicting how long the crisis could last. Pressure in the United States’ housing market reached its peak in 2006, for instance, but the most significant damage to markets did not occur until 2008. Despite the difficulty in putting a timeframe on a potential sequence of events, we can be certain that the margin of safety for global investments is thin and continues to recede.
For perspective, throughout my career, I have never been through a period of longer than five or so years without encountering a highly damaging financial incident. Mexico’s 1982 economic crisis, the stock market collapse of 1987, the credit crunch of 1989, the bond market collapse in 1994, the Asian financial crisis of 1997-1998, the bursting of the dot-com bubble from 2000 to 2002, and the U.S. subprime mortgage crisis which began unfolding in 2007 and bottomed in 2009 are like the tolling of a bell. As we move further into the second half of 2013 and 2014, it would not be a surprise to hear it toll again...and investors would do well to remember the 17th century words of John Donne, “...never send to know for whom the bell tolls; it tolls for thee.”
Chart of the Week
China Approaching a Tipping Point?
A rapid increase in private sector leverage in a relatively short period of time often presages major financial crises. Historical examples include the collapse of the Japanese property bubble in 1990, the financial crisis in South Korea in 1997, and the most recent crises in the United States, Britain, and the euro zone, which all happened after private sector debt surged to or above 170 percent of GDP. Chinese private sector leverage has reached this significant level. Over the past four years, non-financial private sector debt in China has more than doubled, primarily driven by massive corporate borrowing endorsed by government officials to maintain economic growth rates. Although the recent data show signs of a stabilization in the Chinese economy, the elevated debt burden should continue to cast doubt over its growth sustainability.
CREDIT TO NON-FINANCIAL PRIVATE SECTOR AS PERCENT OF GDP*

Source: Bank for International Settlements, Haver Analytics, Guggenheim Investments. Data as of 12/31/2012. *Note: The non-financial private sector includes household, non-profit organizations, and private-owned and public-owned non-financial corporations. Some contingent liabilities from Chinese state and local governments are also included.
Economic Data Releases
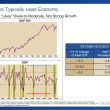
Week of Light U.S. Data Shows Modestly Positive Readings
- Retail sales were up for a fourth straight month in July, rising a slightly less-than-expected 0.2%. Excluding volatile autos and gasoline, sales rose 0.4%.
- The NFIB Index of Small Business Optimism ticked up to 94.1 in July after falling in June.
- Jobless claims rose by 5,000 to 333,000 for the week ended August 3rd. However, the four-week moving average declined to 335,000, the least amount since November 2007.
- Mortgage applications fell 4.7% the week ended August 9th, to the lowest level in over two years.
- Wholesale inventories decreased 0.2%, following a revised 0.6% drop in May.
- Business inventories in the U.S. were flat in June. Forecasts had seen 0.2% growth.
- Producer prices were unchanged from July to June, and rose 2.1% from a year earlier. Price gains were held back by plunging auto costs.
Euro Zone Climbs Out of Recession as China Slowdown Abates
- Euro zone GDP increased 0.3% in the second quarter, after six quarters of negative growth.
- Industrial production in the euro zone grew 0.7% in June. On a year-over-year basis, production had the first positive reading since October 2011.
- German GDP was slightly higher-than-expected in the second quarter, growing 0.7%.
- French GDP growth in the second quarter beat expectations, up 0.5%.
- French industrial production disappointed in June, falling for a second consecutive month, down 1.4%.
- The ZEW survey of the current situation in Germany hit a one-year high of 18.3 in August.
- China’s exports were much stronger-than-expected in July. Exports rose 5.1% year-over-year after a 3.1% drop in June.
- Chinese industrial output rebounded to 9.7% growth in July from a year earlier.
- Second quarter Japanese GDP expanded for the third straight quarter. However, the pace of growth, which was at 2.6%, was slower than expected.
Copyright © Guggenheim Partners