Asset Allocation & Rebalancing Review | 6 August 2013
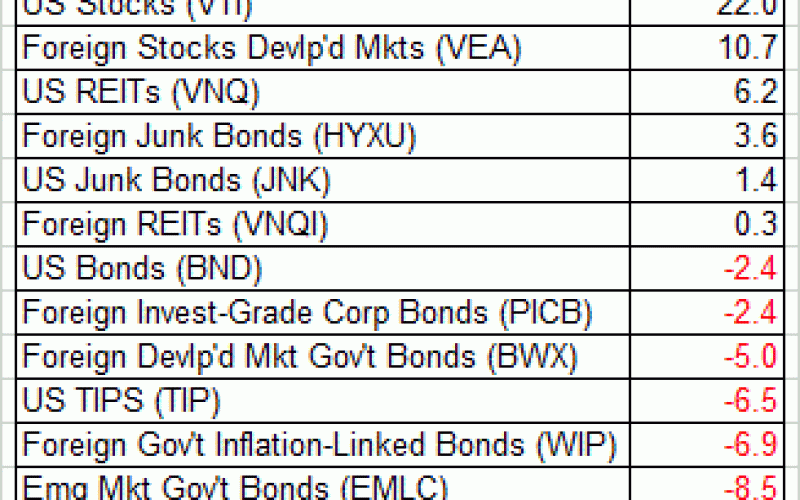
It doesn’t get much better than this for US stocks... or does it? Hold that thought as we take a brief tour of the major asset classes by way of ETF proxies. By this accounting, the US stock market remains on a tear, surging higher by 22% so far this year on a total-return basis through August 5. Foreign stocks in developed markets are looking stronger too, although the year-to-date rise of around 11% still pales next to US equities.
At the opposite end of the horse race: commodities, broadly defined, have shed more than 11% in 2013 through yesterday. As usual, there’s a wide array of differences within the broad brush realm of raw materials. Crude oil, for instance, is sitting on a handsome gain this year while gold is down sharply. Emerging market stocks, by the way, have rebounded a bit in recent weeks, and so this slice of the global markets is no longer the biggest loser. Nonetheless, our proxy ETF for emerging market equities is still lower on the year by 10% through August 5.
For another perspective on how the year looks so far, here’s a recap of an equally weighted portfolio of all the major asset classes in terms of relative changes to the asset allocation. Using a start date of Dec. 31, 2012 for the equal weights, the chart below depicts the current portfolio structure in context with the range of allocations year to date. The strategy for this illustration is equally weighting everything and letting the unmanaged allocations fluctuate freely through yesterday’s close (August 5).
Finally, here's a graphical review of how the major asset classes have performed this year (based on daily closing prices) in relative terms through August 5, 2013. In the chart below, all the ETF prices have been reset to 100 as of Dec. 31, 2012:


