
A Couple Conundrums
by James Paulsen, Chief Investment Strategist, Wells Capital Management
In recent decades, the financial community has faced two significant conundrums. First, after rising steadily since WWII, monetary velocity (the rate at which the money supply is converted into nominal GDP) has persistently declined in the last three decades. This has severely lessened the efficacy of monetary policy and heightened the challenge of managing the pace of growth in the economy. Second, since 2000, portfolio management has been complicated because the relationship between stock and bond returns has undergone a watershed transformation becoming strongly inversely correlated.
Neither of these two relationships, nor why they have changed so much in recent decades, is well understood. A common thought is money velocity is declining because balance sheets are so impaired they simply no longer have the capacity to respond to monetary easing. The delinking of stocks and bonds is often attributed to heightened investor fears of depression rather than just recession. Since Japan collapsed in the early 1990s and since the dot-com meltdown in 2000, bad news seemingly no longer signifies a moderating economy (which in earlier times often produced a rally in both bond and stock prices) but rather a collapsing economy which today forces bond prices up and stock prices lower.
Our view is these two conundrums are reflections of the same phenomena. Both are explained, not so much by economic fundamentals, but rather by a cultural mindset change which began in the early 1980s and has since matured. Moreover, both conundrums are currently at record-setting extremes. That is, monetary velocity has been declining faster and financial market correlations have been more negative than at any time since at least 1920. Most importantly, understanding these developments should be of great interest to policy officials and investors alike since both relationships seem poised to soon undergo another significant shift.
Velocity & the stock-bond correlation
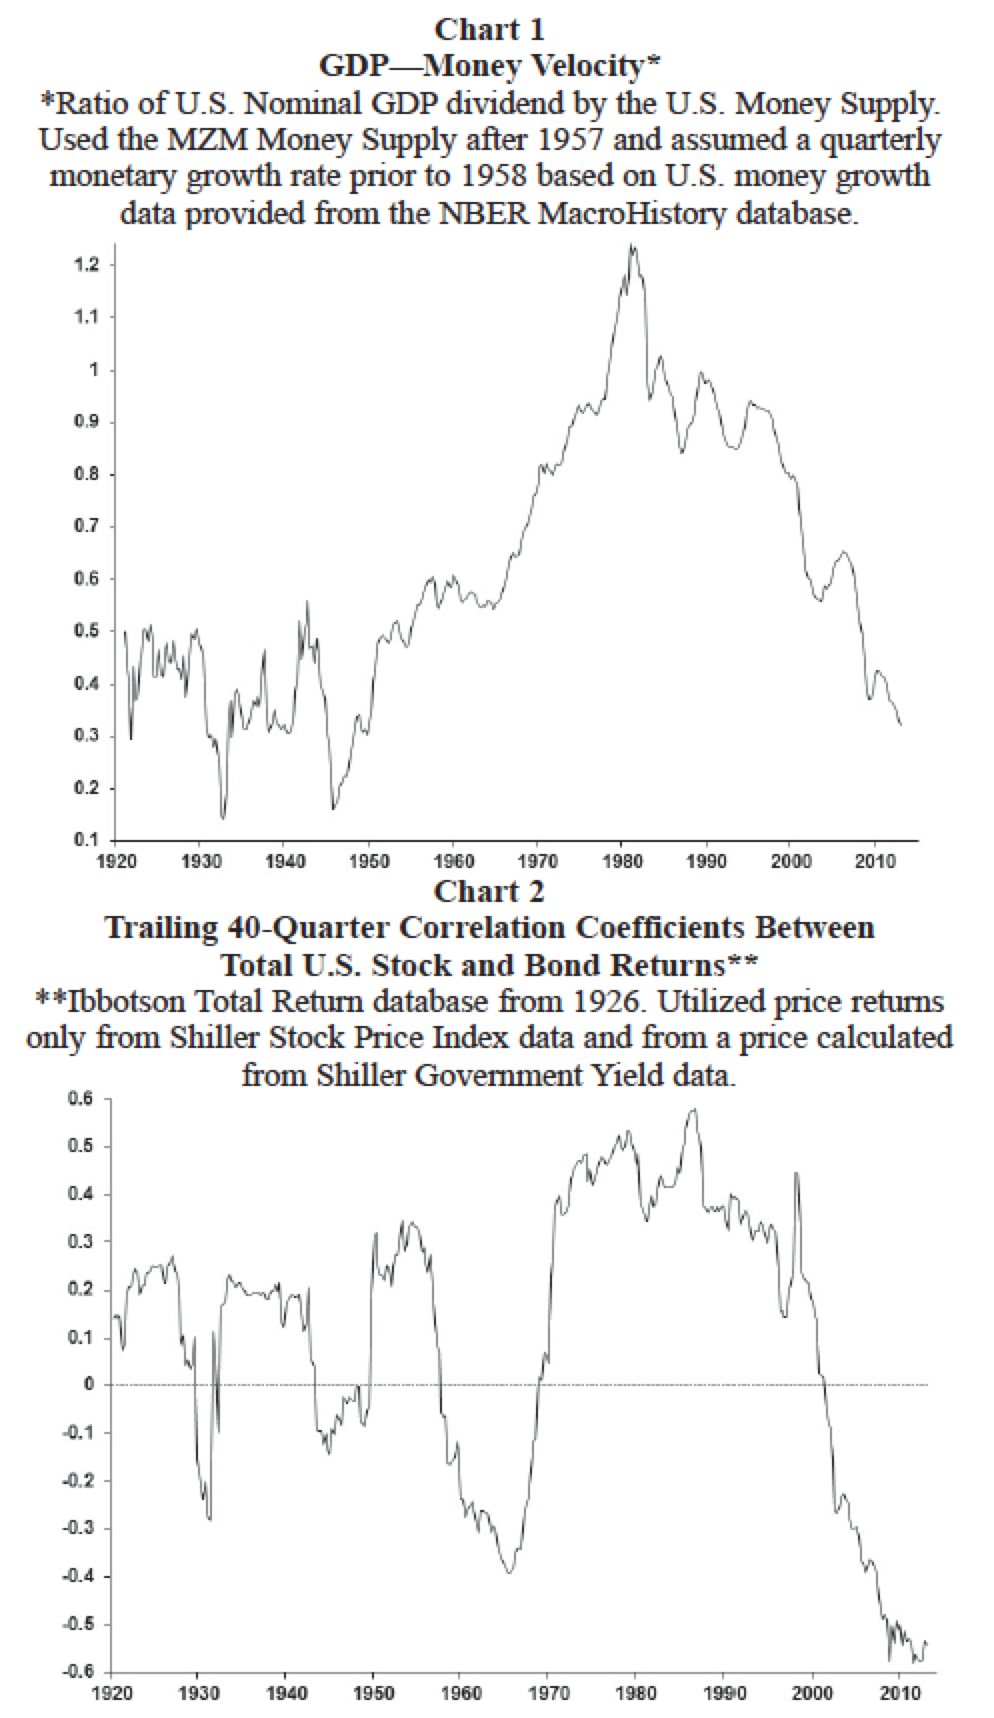
Monetary velocity (Chart 1) is the ratio of nominal GDP divided by the U.S. money supply. Essentially, it shows the level of nominal economic activity supported by current monetary conditions. Its growth rate highlights the efficacy of monetary policy—that is, the growth of velocity is the additional economic activity resulting from an added dollar of money supply.
As shown, U.S. velocity has had a diverse history. Between 1920 and 1950, it trended sideways interrupted by a couple severe declines during the Great Depression and again after WWII. Beginning in the late-1940s, however, velocity embarked on a steady rise spanning three decades and culminating with a spike at the end of the 1980s. During this period, the “impact” of monetary policy (i.e., the bang for the buck) constantly rose and strengthened. It is therefore easy to understand why, in this era, monetary policy (led by Milton Friedman) came to dominate economic thought. Indeed, by the late-1970s, velocity rose so aggressively that it required excessive monetary tightening to slow nominal economic activity. In the 1980s, however, the relationship between monetary growth and the economy changed abruptly as velocity began a decline which would persist to the current day.
Today, the most important questions facing policy officials are why has velocity been declining and when will it rise again? If velocity continues to decline, even continual and aggressive easing by the Fed may not be sufficient to keep the economy healthy. Alternatively, should velocity suddenly rise again, the Fed may find its policies to be far too aggressive. Most currently believe the economic recovery is being held back, despite unprecedented monetary accommodation, by declining velocity. And, velocity is thought to be weak because balance sheets are so impaired. In response to these concerns, the Fed has adopted massively stimulative policies aimed at improving balance sheet integrity and ultimately velocity. While these concerns do have some legitimacy, how do today’s weak balance sheets explain why velocity has been declining for more than 30 years?
A history of the relationship between stock and bond returns is shown in Chart 2. Most commonly, stock and bond returns move in the same direction (i.e., are positively correlated). Since 1920, the trailing 10-year correlation of monthly total returns between stocks and bonds has been positively correlated about 70% of the time. Normally, lower interest rates (i.e., falling bond yields or rising bond prices) are perceived as improving future economic prospects leading to a higher stock market and a positive relationship between stocks and bonds. There have, however, been some extended periods when stock and bond returns were inversely correlated including the Great Depression era, around WWII, in the 1960s, and in the contemporary era.
Until the last decade, most of the contemporary investment generation had only experienced a “normal” positive relationship between stock and bond returns. The abrupt change in this relationship since 2000 has been unsettling for investors and has significantly altered the risk-return frontier and conventional portfolio allocation decisions. Like the Fed, investors are left to ponder why the relationship between stock and bond returns has changed so dramatically and whether this new relationship will persist or soon return to normal?
Are these financial puzzles related?
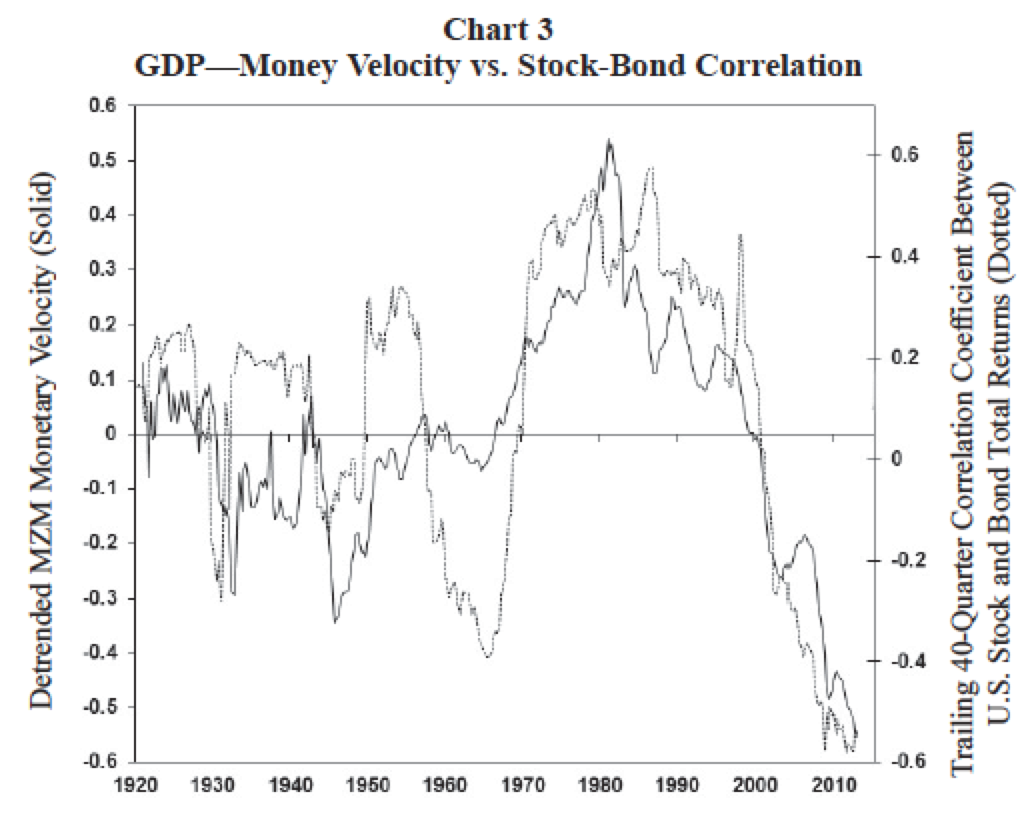
While it is not obvious, historically, it appears movements in monetary velocity are similar to the return relationship between stocks and bonds (return correlations). Chart 3 overlays the stock-bond correlation (Chart 2) with detrended money velocity (detrended velocity shown by the solid line in Chart 3 rises when velocity grows faster than its historic average and declines when velocity rises slower than its historic average). Although far from identical, movements in money velocity and financial market correlations have been remarkably similar since 1920. Both experienced significant declines during the Great Depression and during the WWII era. Both declined from the mid-1950s to the mid-1960s (although the magnitude of the correlation change was much more dramatic than the change in velocity), both rose in an unprecedented fashion between the mid-1960s to 1980 and both have since collapsed. Based on this history, it appears quite likely velocity will not strengthen until the stock-bond correlation increases and/or correlations will not rise until velocity increases. That is, are these two financial puzzles actually only a single puzzle with a common cause?
Fallout from price stability?
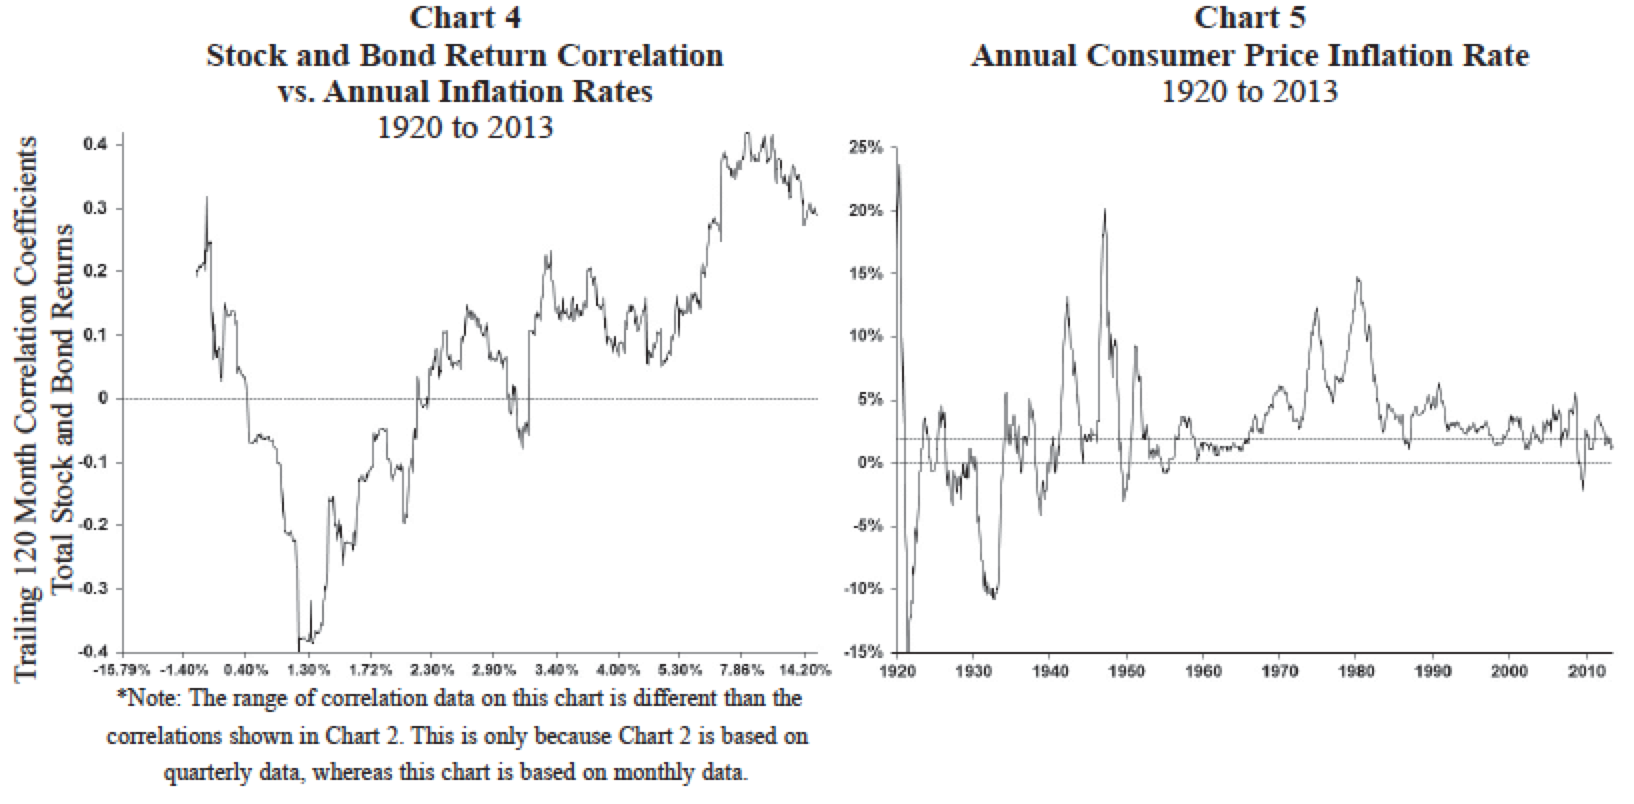
Since at least 1920, both monetary velocity and financial market return correlations have been highly sensitive to the inflation environment. In most inflation environments, velocity has risen and financial correlations have been positive. However, both have declined significantly whenever the economy has neared “price stability”—that is, when the overall consumer price inflation rate nears zero. This is illustrated by Charts 4 and 5.
Chart 4 shows the trailing 10-year stock-bond return correlation coefficients since 1920 ranked by annual consumer price inflation rates. The horizontal axis displays every annual consumer price inflation rate since 1920 ranked from the lowest recorded annual inflation rate (i.e., almost 16% deflation) to the highest recorded annual inflation rate (almost 24%). For each recorded inflation rate, the vertical axis shows the corresponding trailing 10-year stock-bond return correlation.
The four separate and significant bouts of negative return correlation between stocks and bonds since 1920 (discussed earlier and shown in Chart 2) have essentially occurred only when the consumer price inflation rate neared stability—that is, when inflation trended in a range between about 0% and 2%. Chart 5 highlights the range of annual inflation rates between 0% and 2% since 1920 which produced negative financial market return correlations and declines in monetary velocity. For the most part, when inflation is outside of this “price stability” zone, correlations and velocity have tended to return to normal. So, why does price stability so dramatically alter these two important relationships?
Altering the mindset
The performance and character of both monetary velocity and market correlations seems to be primarily driven by mindsets shaped by different inflation environments. That is, movements in velocity and financial market correlations seem to be driven more by confidence and fears than by fundamental economic issues.
Chart 6 replicates the financial market correlation history ranked by the inflation rate. We have separated this chart into four segments representing distinct cultural mindsets shaped by different inflation environments. We offer a brief description, in our view, of the cultural mindset evident in each inflation environment and also discuss how the Fed’s challenges are altered.
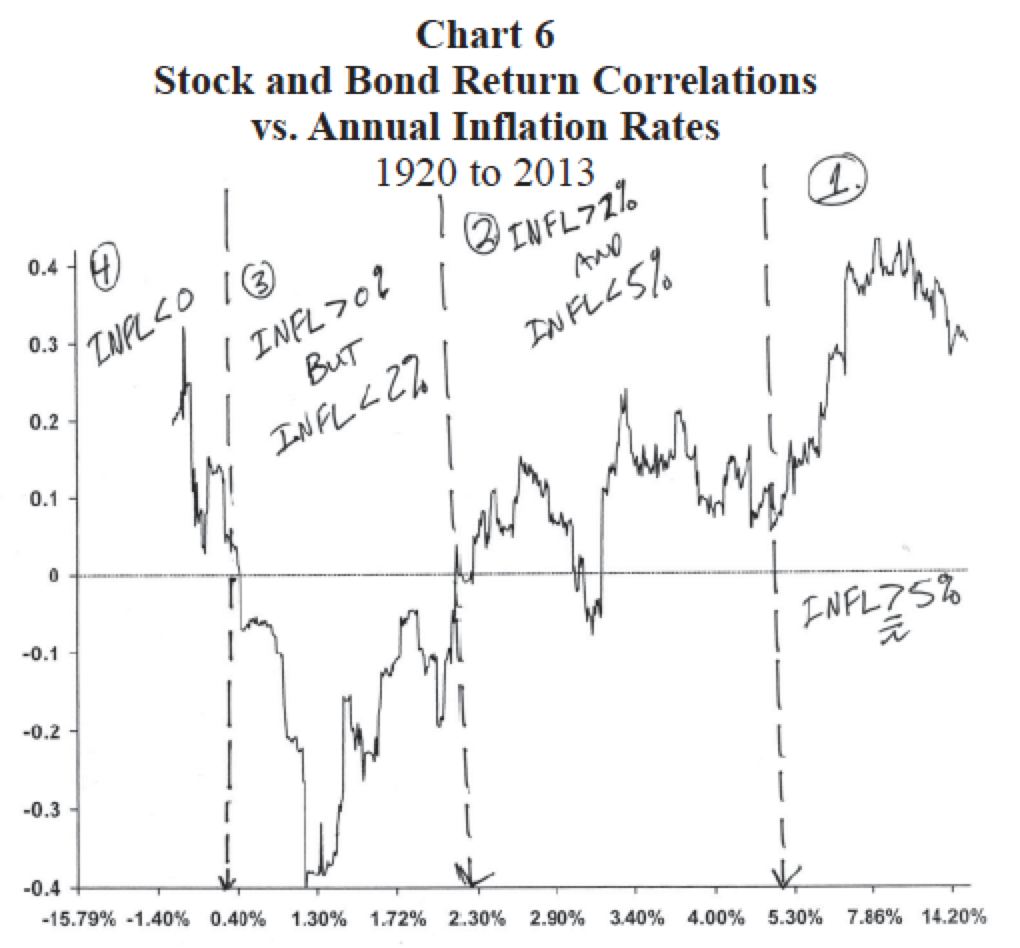
1. When inflation rate is above 5%
Investor Mindset
When inflation strengthens to this extent it tends to dominate mindsets. Consequently, in high inflation eras the investor mantra becomes “good news is bad news” for both stocks and bonds. When inflation dominates concerns, any report suggesting a stronger economy raises inflation worries which lowers both bond and stock prices by driving yields higher and price-earnings multiples lower. That is, stock and bond returns become highly positively correlated.
The Fed Challenge
When inflation escalates above 5%, economic players become highly attuned to inflationary risk (think 1970s). Escalating inflation expectations make “nominal” economic growth hyper-sensitive to monetary policy. Often, with hyper-inflationary mindsets, monetary policy loses its ability to impact “real growth” since easing only worsens price inflation. Velocity typically soars as a cultural mindset dominated by rising inflation expectations causes monetary policy to have a big bang for the buck!
2. When inflation rate is between 2% and 5%
Investors' Mindset
This represents the “normal era” for investors. When inflation oscillates in a more “normal” range, most are not overly worried about excessive inflation or depression. Rather, real growth rises with modest inflation (good for earnings) and “good news is good news” for stocks. For bonds, in this environment, “Good News” can be good, bad, or indifferent. Without any real concern about runaway inflation, bond yields often are almost invariant to improved economic growth provided the real bond yield is positive. Consequently, in this inflation environment, the correlation between stock and bond returns is typically only slightly above zero. That is, stock and bond returns are nearly independent (think 1960s when stock price rose and bond yields were flat).
The Fed Challenge
In this era, monetary policy has its greatest impact on “real economic activity” with far less impact on price inflation. Since most players are confident in the recovery but not exercised about potential inflation risk, easing by the Fed mostly impacts real growth. This is the normal era for investors but is the golden era for the Fed (think 1960s when conventional thought was we had cured the economic cycle and now economic policy could simply be used to tweak economic results). Velocity is healthy in this era but not as strong as in high inflation periods since money growth does not lead to excessive inflation and therefore does not boost “nominal GDP” as significantly.
3. When inflation rate is between 0% and 2%
Investor Mindset
When inflation is in this region—since it is so close to zero—investors worry about a potential collapse in the economy. In this era, the investment mindset is “bad news is bad for stocks but good for bonds.” Consequently, financial market correlations decline by more than at any other time. Inflation risk is ignored and the entire focus becomes obsessed with “real economic growth.” The consensus outlook become bimodal—either the economy is going to be OK (stock prices rise and so do bond yields) or a depression is feared (stock prices decline and so do bond yields). Stock and bond return correlations become remarkably negative as the investment community oscillates between a return to “normal” or the “end of the world.”
The Fed Challenge
When inflation nears zero, the impact of monetary policy on either inflation or real growth is significantly diminished by declining velocity. Indeed, velocity weakens more significantly in this inflation era than in any other. Fundamental problems may contribute to weakness in velocity, but the primary problem facing the efficacy of monetary policy is “confidence” rather than weak fundamentals. Lower yields or higher levels of liquidity do little to quicken growth if most fear a depression looms. The same attitude which produces a significant negative correlation structure in the financial markets begins to neuter the prowess of the Fed’s fundamental fixes. Indeed, panicky policy official actions (like excessive easing or chronically attempting to lower bond yields) may actually accentuate the dominant fearful culture driving velocity lower.
4. When deflation results
Investor Mindset
For investors, this era represents their worst fears. The system is perceived as broke (the Greece situation in the contemporary era) and the entire economy and its institutions are perceived at risk. The prescription is to “sell everything on bad news” (including stocks but also even government bonds since sovereigns may fail as well) or “buy everything if it is actually going to survive.” Consequently, stock and bond returns become highly positively correlated. Indeed, financial market correlations are nearly as strong during deep deflations as they are during eras of rapid inflation (but for an entirely different reason).
The Fed Challenge
Contrary to popular belief, velocity actually increases during eras of deflation. For example, from Chart 1, see the mid-1930s, the late-1930s, and again at the end of the 1940s. In each of these cases, deflation was evident but velocity strengthened. In this fashion, monetary velocity improves in conjunction with rising financial market correlations. Not sure why monetary velocity rises in deflations, but suspect it may have to do with the same deflation-era attitude shift which characterizes the financial markets.
That is, does velocity improve during deflations simply “because” financial market correlations (and the cultural mindset) improve?
Summary & implications?
Although not widely appreciated, in the last 100 years, monetary velocity and the correlation structure of the financial markets has been remarkably similar. The correlation of stock and bond returns has been the strongest during periods when monetary velocity has risen and financial market returns have been inversely related when monetary velocity has been weak. What drives monetary velocity or alters the correlation structure of the financial markets is not well understood. We believe they both have a common driver—a cultural mindset established and altered by differing inflation environments.
That is, monetary velocity and the risk-return frontier faced by investors (i.e., stock-bond return correlation) seems to be guided more by changes in economic confidence (a mindset) than by economic fundamentals. Several implications are noteworthy.
First, the annual rate of consumer price inflation is currently 1.4%. This suggests the contemporary mindset is shaped by the 0% to 2% inflation environment and resides almost at the nadir of the historical inflation rate-financial market correlation curve illustrated in Chart 6. This is a position of great potential peril and of fantastic potential opportunity. If the inflation rate continues to decline toward and below zero (i.e., we move northwest in Chart 6), the cultural mindset about the future will worsen and eventually “both” bonds and stocks could suffer significant declines in a deflationary abyss.
Alternatively, if we move northeast along this curve, monetary velocity should begin to improve and stock market returns could remain favorable even if bonds initially suffer a setback. Moreover, if the inflation environment reaches the 2% to 5% range (the normal era for investors and the golden era for the Fed), both stocks and bonds could again experience an era of simultaneous good performance and a feel of normalcy could return to the economy.
Second, since the contemporary mindset is currently shaped by a 0% to 2% inflation environment, the primary concern for most is still the potential for a deflationary depression. This implies any evidence of reinflation (like last Friday’s payroll employment report which showed a surprising rise in the wage inflation rate to 2.2%) may be a welcomed result in the intermediate period. Indeed, from Chart 6, moving toward the northeast (i.e., increasing inflation) would likely improve velocity, boost nominal economic activity, and lessen cultural mindset fears.
Third, until inflation rises above 2%, both stock prices and bond yields are likely to rise, since the cultural mindset is still in an “inverse stock-bond correlation” position. Even if inflation rises above 2% again (as suggested by Chart 6), velocity, real economic growth, and the stock market may continue to rise. However, perversely, bond yields may stop rising again once inflation rises above 2%. That is, currently the cultural mindset seems to be experiencing an initial move upward and to the right along the curve in Chart 6. A revival of economic confidence is causing a repricing in both stocks and bonds (stocks upward and bonds downward). Once the 10-year yield is repriced for “not the end of the world” (perhaps a 4%-ish bond yield may be appropriate if the cultural mindset comes to believe the recovery is sustainable), then we may enter a new cultural mindset (a 2% to 5% inflation environment) whereby the “adjusted” bond market may also be OK again.
Fourth, while movements in velocity and financial market correlation are related, which leads which? Recently, the stock-bond return correlation has improved. Does this suggest an imminent rise in monetary velocity is forthcoming? This would surely surprise most economic forecasters, most investors and most notably, the Fed.
Fifth, if confidence is finally starting to gear and inflation does move into the 2% to 5% range in the next few years, we may be on the cusp of a sustained rise in both financial market correlations and monetary velocity. Both velocity growth and the financial market correlation are at record lows leaving considerable upside room for normalization! Consequently, investors, policy officials, and private economic players should consider whether they are prepared for a sustained revival in velocity and correlations.
Sixth, if we are at the front-end of an upward turn in both velocity and financial correlation, investment leadership will likely undergo a significant change. From the mid-1960s to about 1980 when correlation and velocity mostly rose, small cap and cyclical stocks outperformed while Treasury bonds and defensive stocks performed poorly. By contrast, since 1980, when both correlation and velocity have mostly declined, small cap and cyclical stocks have frequently underperformed and Treasury bonds and defensive stocks have mostly been strong. If we are nearing a “secular” change in velocity and financial correlations, investment leadership will also likely undergo a major transformation. How will inflation protected Treasury securities perform in a new rising velocity era? Will dividend-payers continue their performance dominance? Perhaps investors should focus less on the last three decades for guidance and rather study earlier decades for clues (i.e., past periods of rising velocity and stronger financial correlations)?
Seventh, rather than being alarming, it is encouraging the Fed has recently begun to shift its attention towards boosting confidence (by beginning to taper policies) rather than just focusing on fixing fundamentals. Ever since the 2008 collapse, the Fed has employed massively accommodative monetary policies aimed at improving liquidity, restoring balance sheets, and keeping yields low. In short, its goal has been to improve damaged economic fundamentals.
These policies have certainly helped return the economy to a recovery. However, they have also likely had an unintended negative consequence on economic growth. The chronic implementation of an “unconventional, crisis-like monetary policy” has persistently communicated a message to investors and private economic players that the Fed believes the economy remains weak, broken, and vulnerable.
So while monetary policy may have improved fundamentals it has also probably continued to erode confidence. Indeed, this may have contributed to velocity staying weak and financial correlations remaining inversely correlated. Is it simply a coincidence that financial market correlations are improving at the same time the Fed is finally openly discussing an exit strategy? Rather than fear tapering, could investment correlations and monetary velocity embrace this show of Fed confidence by starting a sustained advance for the first time in this recovery?
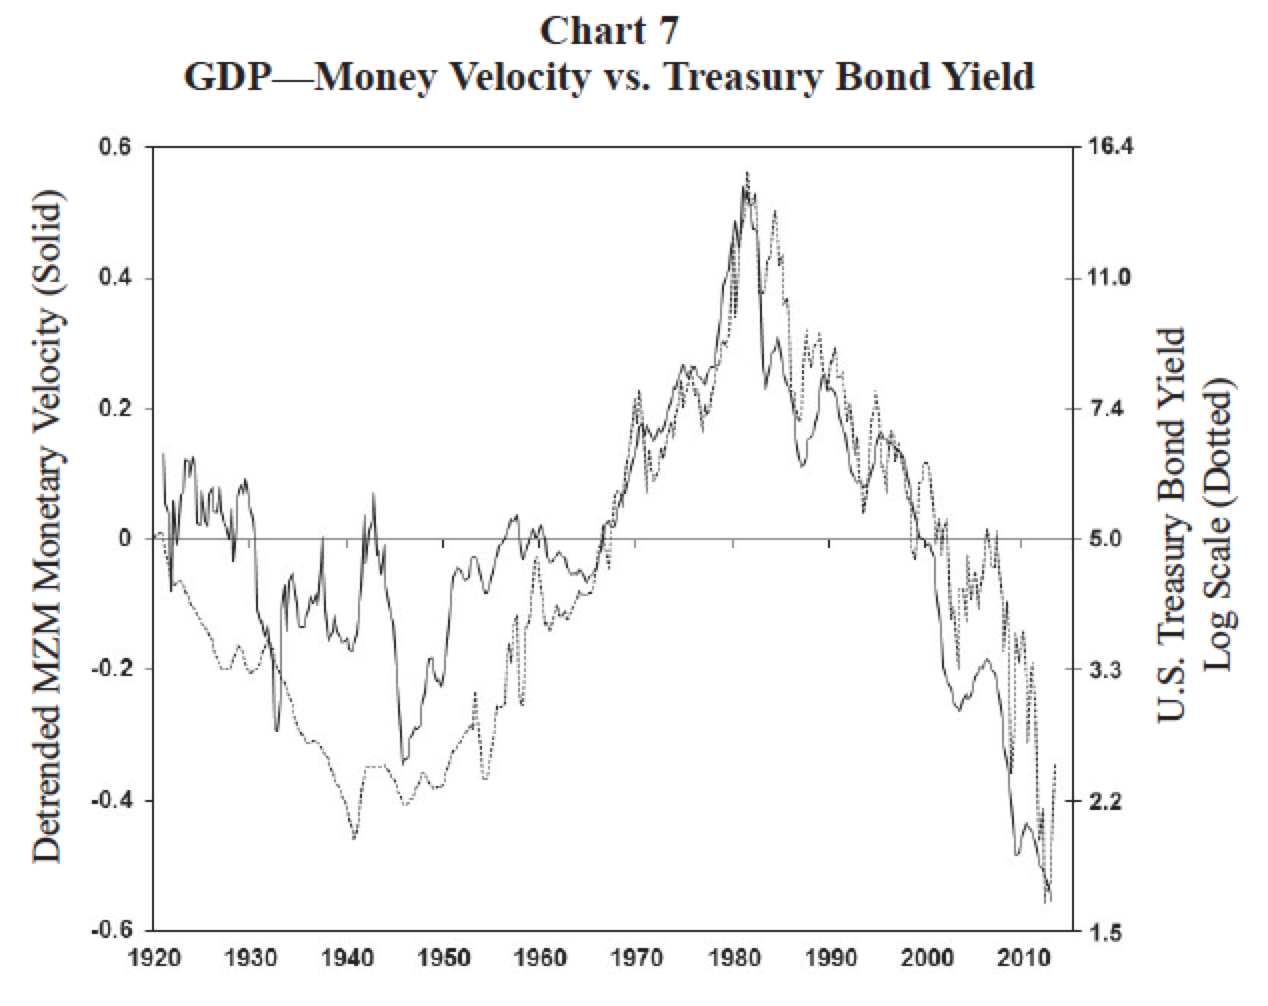
Finally, should the Fed really keep yields so low? Chart 7 illustrates velocity is highly correlated with bond yields. A suggested by Chart 7, have Fed actions actually suppressed confidence and thereby money velocity by keeping yields artificially low? Would concerns about a potential depression be as widespread and as strong today if the 10-year yield were 4%, if short-term rates were above 1%, and if quantitative easing (QE) wasn’t constantly reinforcing the impression the Fed was out of bullets? Perhaps, the Fed backing away from QE is just the tonic which will finally allow velocity and financial correlations to begin strengthening.

Wells Capital Management (WellsCap) is a registered investment adviser and a wholly owned subsidiary of Wells Fargo Bank, N.A. WellsCap provides investment management services for a variety of institutions. The views expressed are those of the author at the time of writing and are subject to change. This material has been distributed for educational/informational purposes only, and should not be considered as investment advice or a recommendation for any particular security, strategy or investment product. The material is based upon information we consider reliable, but its accuracy and completeness cannot be guaranteed. Past performance is not a guarantee of future returns. As with any investment vehicle, there is a potential for profit as well as the possibility of loss. For additional information on Wells Capital Management and its advisory services, please view our web site at www.wellscap.com, or refer to our Form ADV Part II, which is available upon request by calling 415.396.8000.
WELLS CAPITAL MANAGEMENT® is a registered service mark of Wells Capital Management, Inc.
Copyright © Wells Capital Management