With the Equity markets continuing to struggle to find direction, for this week's Equity Leaders Weekly we are going to check back in on the Gold Continuous Contract and also the U.S. Dollar Continuous Contract to see what has developed there recently.
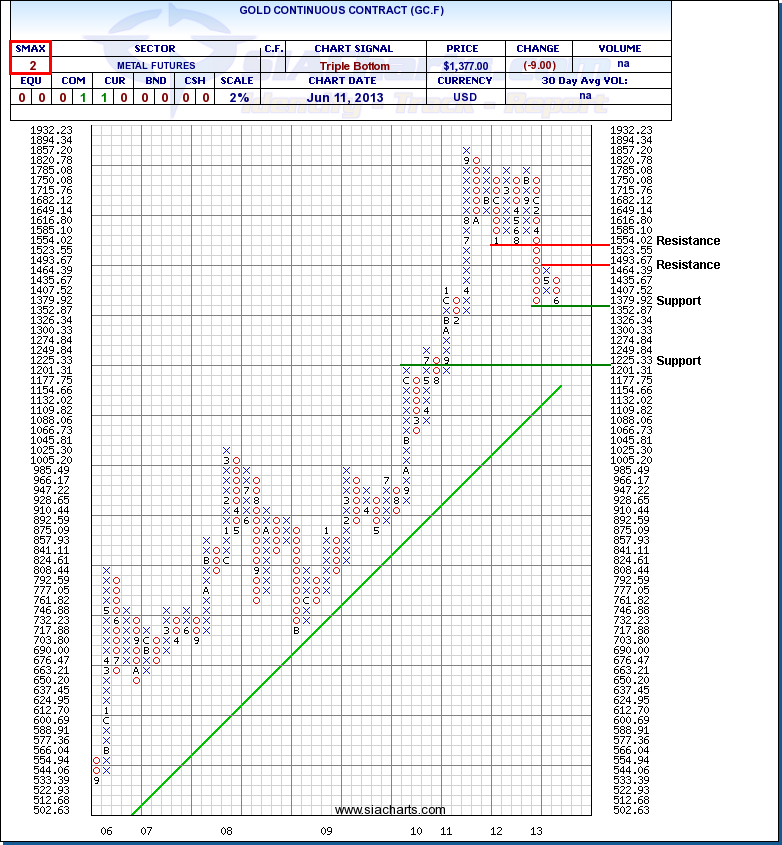
Gold Continuous Contract (GC.F)
After the big drop that Gold took back in April, this commodity then bounced back up right to the first resistance level at $1493.67. Since that bounce, the weakness in Gold has returned as it now rests right on top of the support level from April at $1352.87. Should that level break there may be some minor support at the $1300 level, but the next major support does not come in to play again until around $1200, giving Gold plenty of potential downside room to move.
It is also important to note that Commodities as an asset class continue to sit at the very bottom of the relative strength rankings in the SIA Asset Allocation Model in 7th spot, and as a sector, Metals and Mining also remain at the bottom of the relative strength stock sector rankings in the 31st position.
Click on image to enlarge
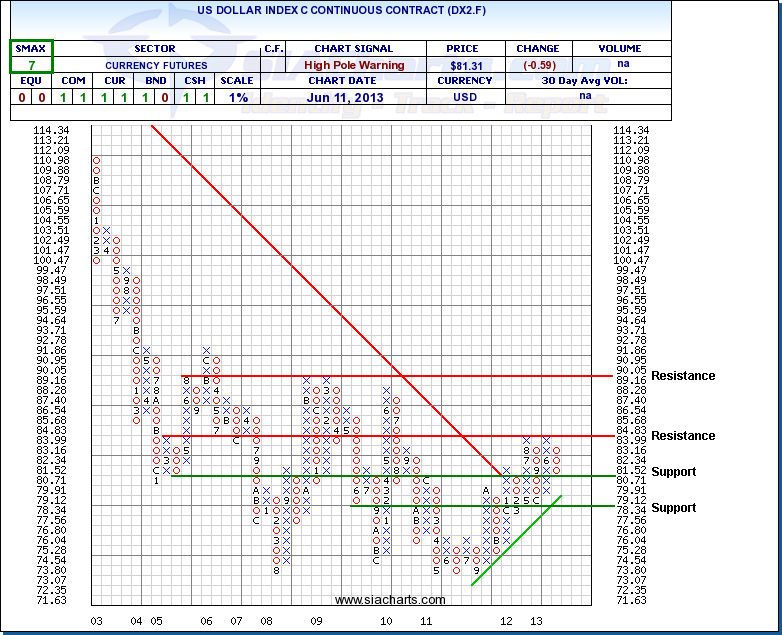
US Dollar Index Continuous Contract (DX2.F)
Since we last looked at the DX2.F three weeks ago, we can see from the chart that the resistance level at 84.83 has held, and that the US Dollar Index Continuous Contract is now sitting on its first support level at 80.71. Should this support level break, then DX2.F will have to immediately deal with the rising trend line before the next support comes in to play at 78.34, which would then signify a true reversal in the U.S. Dollar Index.
Both Gold and the U.S. Dollar Index have seen a pullback over the past few weeks, with Gold sitting precariously on support, while the DX2.F appears to be waiting for some direction right now. These two charts need to continue to be monitored as strength in the U.S. Dollar Index and weakness in Gold will likely correspond with continued strength in U.S. Equities.
Click on image to enlarge
Copyright © SIACharts.com