If you compare an intraday chart of the S&P 500 and the US Dollar relative to the Japanese Yen during Tuesday's trading, they couldn't have tracked each other much more closely. At the 9:30 open today, the S&P 500 opened lower as the Dollar was already weak overnight. Throughout the morning, the S&P 500 rallied as the Dollar strengthened (rising red line). In the afternoon, though, the Dollar weakened again (falling red line) and along with it the equity market gave up all of the ground it made in the morning. Throughout the afternoon, the two tracked each other step for step as the equity market and Dollar tried to rally and then gave up ground again finishing near the lows of the day.
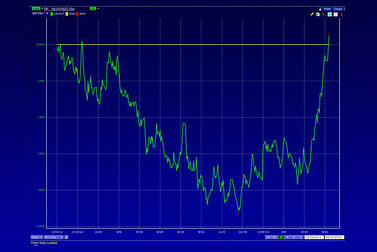
The close correlation between the S&P 500 and Japanese Yen has been in place for much of 2013 so far. While we believe that a strong dollar (and weak Yen) is ultimately good for the US equity market, we would note that these correlations can be cyclical in nature and reverse themselves as quickly as they come into play. The chart below provides a perfect example. From June 2012 through October, the S&P 500 rallied as the dollar fell relative to the Yen. Then from October through year end, the S&P declined as the dollar rallied. It wasn't until December when the two started moving in the same direction.
Copyright © Bespoke Investment Group