“Never on a Friday”
by Jeffrey Saut, Chief Investment Strategist, Raymond James
June 3, 2013
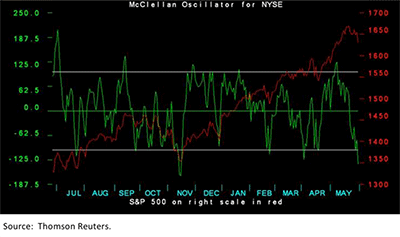
“Never on a Friday ... is a mantra I crafted back in the 1970s that has stood the test of time, meaning markets rarely bottom on a Friday if they are into some kind of feint, or even a sideways move. To be sure, markets typically don’t bottom on a Friday, thus giving investors the weekend to brood about their losses and then show up in ‘sell mode’ on Monday/Tuesday; aka, ‘Turning Tuesday’. So I would not be too aggressive with stocks today (last Friday), but I think by next Tuesday the stock market’s internal energy will be rebuilt. And, if we get some more downside today, the McClellan Oscillator will be even more oversold. So I would look for some kind of bottom the first part of next week and then for a move up into the June 10/12th ‘timing point’ I have spoken about.”
... Jeffrey Saut, morning verbal strategy comments (5/31/13)
Those were my verbal comments last Friday in the 9:00 a.m. strategy call, but quite frankly I didn’t expect to get what we actually got late in Friday’s session when the S&P 500 (SPX/1630.74) knifed through its previous support level of 1640. Indeed, for the past few weeks the SPX has been trapped in a trading range between roughly 1640 and 1675 and when the bottom of that range was violated at 3:50 p.m. last Friday the rout was on! The result left the SPX at 1630.74, causing certain seers to exclaim, “A Hindenburg Omen has been triggered.” Recall a Hindenburg Omen requires (according to Zero Hedge):
1) The daily number of NYSE new 52-week highs and the daily number of new 52-week lows must both be greater than 2.2 percent of total NYSE issues traded that day.
2) The smaller of these numbers is greater than or equal to 69 (68.772 is 2.2% of 3126). This is not a rule but more like a checksum. This condition is a function of the 2.2% of the total issues.
3) The NYSE 10-week moving average is rising.
4) The McClellan Oscillator is negative on that same day.
5) The new 52-week highs cannot be more than twice the new 52-week lows (however it is fine for new 52-week lows to be more than double new 52-week highs). This condition is mandatory.
Over the past 10 years there have been many Hindenburg Omens triggered, but to my knowledge only one of them has actually worked (The Wall Street Journal 8/23/2010 article states the accuracy is only 25%, looking at the period from 1985). Actually, the last Hindenburg signal (December 2012) proved to be an exceptionally good point to buy stocks. I expect this “Omen” will prove to be yet another false signal because the McClellan Oscillator is just about as oversold as it ever gets (see chart on page 3). Moreover, Friday’s Fade brought the SPX back down to 1630, which is where the latest “up move” started from on May 14th. Accordingly, 1630 should act as some kind of support level. So, what happened on Friday is not all that worrisome to me for the aforementioned reasons, but also because the stock market’s internal energy is almost completely rebuilt, suggesting any weakness the first part of this week is for buying, looking for a short-term rally into the June 11/12th timing point. Of course that timing point mention has elicited numerous questions as to how I arrived at that date. My response has been, “My timing models have targeted that date, not me.” And from a news backdrop, Germany’s Constitutional Court is going to hold hearings on June 11/12th to hear complaints about the euro zone’s bailout fund, the European Stability Mechanism (ESM), and the European Central Bank’s bond-buying program. I think those hearings have a decent chance of rattling world markets. Still, I expect the mid-June weakness to be short-lived with higher highs due into the first part of July.
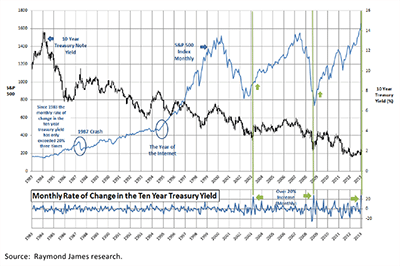
Now some pundits attributed last week’s weakness to the softening economic figures. Admittedly, of the 18 reports that were released, seven came in better than expected and 11 were weaker. This week even more reports are due, including Friday’s all important non-farm payroll report (165,000e). Other pundits suggested the Weekly Wilt was caused by the rise in interest rates. To this point, the chart on page 3 shows that since 1983 the monthly rate of change in the 10-year Treasury yield has only exceeded 20% three times. That happened early in 2003, followed by a rally that lifted the SPX from ~1000 to ~1500 by July of 2007. The 20% delta happened again in February 2009, and we all know how that turned out. Over the past few weeks it has occurred for a third time and it should be interesting to see if we get a similar result as seen in the two previous cases (see chart on page 3). That said, if the timing models continue to play as well as they have been, the real point of vulnerability should come in mid-July.
Since the string began on January 15th, every Tuesday has experienced a rally. Last week was the 20th winning Tuesday in a row for the longest Tuesday winning streak since 1900. Over that same timeframe the D-J Industrial Average (INDU/15115.57) has gained 1902 points with 1573 of those points coming on Tuesdays. Hereto, it should be interesting to see if Turning Tuesday lives up to its name this week as the Tuesday skein closes in on Wednesday’s record where in 1968 we got 24 “up” Wednesdays in a row. With the month of May now in the “books,” the INDU has had gains for six straight months, and has risen in 17 of the past 20 months, the longest streak since 1951. Speaking of streaks, the “buying stampede” remains intact with today being session 106 without so much as a three consecutive session pullback since the stampede began with the back-to-back 90% Upside Volume days of 12/31/12 and 1/2/13. While many participants are focused on why stocks should not be trading where they are, few are focused on why they should! However, one group that is coming around to the “glass is half full” view are the analysts as last week saw net earnings revisions for the S&P 1500 turn positive for the first time since May 2012. As Rich Bernstein said in our conference call of a few weeks ago, “The stock market does not care about the absolutes of good or bad, but rather if things getting better or worse.” And manifestly, things are getting better as reflected by the growing momentum in the private sector punctuated by the better than expected 3% annualized growth in private domestic demand, which is much faster than the BEA’s estimate. Similarly, real personal consumption expenditures increased 3.42% in 1Q13 versus a rise of just 1.83% in 4Q12.
The call for this week: If you sold in May “To go away,” you should have sold bonds, or the defensive sectors that have acted like bond surrogates, because all of those got shellacked in May. Indeed, the D-J Utility Average (UTIL/482.16) lost about 10.4% in May while the INDU gained 1.86%. The Utilities weakness should have come as no surprise since I have opined for months the Utilities were more richly valued than Technology. Indeed, Utilities command a price/earnings valuation 1.2 times richer than the overall stock market – the largest such margin in nearly three decades. Interestingly, of the 10 macro sectors, only Financials (+0.52%) and Information Technology (+0.58%) were positive last week. So, the SPX has fallen for two consecutive weeks, but one of the good things about a pullback is that you get to see what is “holding up” the best. From their “print highs,” of the indices I monitor, the NASDAQ Composite (COMP/3455.91) is down only 2.16%, while the Russell 2000 (RUT/984.14) has declined the least. This shift in leadership is important and suggests investors should review their portfolios since the strongest demand is moving into Financials, Industrials, and InfoTech.
Copyright © Raymond James


