by Don Vialoux, Tech Talk
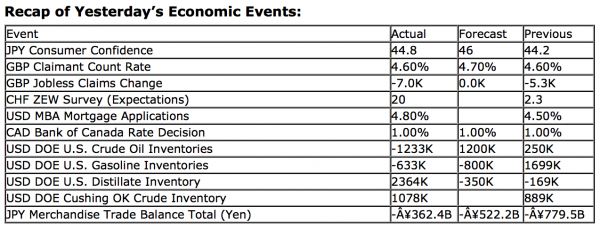
Upcoming US Events for Today:
- Weekly Jobless Claims will be released at 8:30am. The market expects Initial Claims to show 347K versus 346K previous.
- The Philadelphia Fed Survey for April will be released at 10:00am. The market expects 3.3 versus 2.0 previous.
- Leading Indicators for March will be released at 10:00am. The market expects a month-over-month increase of 0.2% versus an increase of 0.5% previous.
Upcoming International Events for Today:
- Great Britain Retail Sales for March will be released at 4:30am EST. The market expects a year-over-year decline of 0.4% versus 2.6%.
Markets dipped on Wednesday, pressured lower by financials and technology following disappointing earnings reports within the sectors. Bank of America plunged 4.72% after it missed first quarter earnings estimates. Apple fell 5.50% following a weak sales outlook from chip company Cirrus Logic, a key supplier for the iPhone and iPad. Apple stock traded below $400 for the first time since December 30th of 2011, just prior to the parabolic climb in the first half of 2012. Shares are down around 42% since the stock peaked in September of last year amidst concerns that the company is losing its market dominance. Wednesday’s decline below $420 broke a key level of support; next level of significant support is now around $360, or around 10% lower than present levels. However, Apple bulls may have reason to be hopeful over the intermediate-term. Momentum indicators have been diverging with the recent price action, suggesting that selling momentum may be waning. The stock declined on substantial volume in the fourth quarter and into the start of the new year, but recently volume has gradually declined as price stabilizes and investors begin to anticipate some kind of bottom. The spike in volume on Wednesday could be implied to have washed out weak hands that recently entered, essentially beginning the process of stabilization once again. From a seasonal perspective, the stock typically trades higher following earnings, which are due to be released on April 23rd. Apple anyone?
Wednesday’s decline in equity markets saw the S&P 500 index test the 50-day moving average as a point of support. Declines below this significant moving average would likely bring upon a flood of selling pressures as investors seek to lock in gains following the stellar six month run in equity markets. Looking out on the weekly chart, “Sell” signals are in the midst of being triggered. The weekly RSI is rolling over from the most overbought level since February of 2011. Weekly Stochastics are curling lower. And the weekly MACD is on the verge of crossing below its trigger line. Using moving averages as a guide, the benchmark could soon test the 50-week moving average, presently around 1435, should a change of trend become confirmed. This significant moving average has held as support twice over the past year, allowing longer-term traders to accumulate equity positions at appealing levels. Risk-reward of the equity market favours a move lower, a scenario which has more likelihood of occurring as the period of seasonal weakness for equities gets set to begin.
Seasonal charts of companies scheduled to report earnings today:
Sentiment on Wednesday, as gauged by the put-call ratio, ended bearish at 1.19.
Chart Courtesy of StockChart.com
Chart Courtesy of StockCharts.com
Horizons Seasonal Rotation ETF (TSX:HAC)
- Closing Market Value: $13.31 (down 0.60%)
- Closing NAV/Unit: $13.29 (down 0.95%)
Performance*
| 2013 Year-to-Date | Since Inception (Nov 19, 2009) | |
| HAC.TO | 4.48% | 32.9% |
* performance calculated on Closing NAV/Unit as provided by custodian
Click Here to learn more about the proprietary, seasonal rotation investment strategy developed by research analysts Don Vialoux, Brooke Thackray, and Jon Vialoux.
Copyright © Tech Talk


