


In this week's version of the SIA Equity Leaders Weekly, we are going to concentrate on the commodity crash that happened this past week by looking at the Gold and Silver Continuous Contracts. If you have been following us for a while, you will have noticed we have stayed away from Commodities as an asset class for the past 19 months and warning of the relative weakness along the way.
Gold Continuous Contract (GC.F)
The commodity crash finally happened after we have continued to highlight the external influences at play with the strength of the 30-Year Yield and the U.S. Dollar that was continuing to put downward pressure on Gold. Gold had been stuck in a channel for the past two years but has broken through to the downside with the biggest move since 2008 closing underneath the prior support level at $1407. If the weakness reverses, resistance can be found at $1464.39 and at $1554.02, which was a prior support level at the bottom of the channel but now serves as a resistance level.
So where is the support for Gold in the future if it continues to drop? Support can be found at $1300.33 and at the $1201.31 level. With the SMAX at 2, Gold continues to show near-term weakness against the other asset classes.
Currently the SIA Asset Allocation Model is showing Commodities in the 7th position (out of 7) and the Metals and Mining sector is ranked 31st (out of 31) and these areas continue to be a higher risk relatively.
Click on Image to Enlarge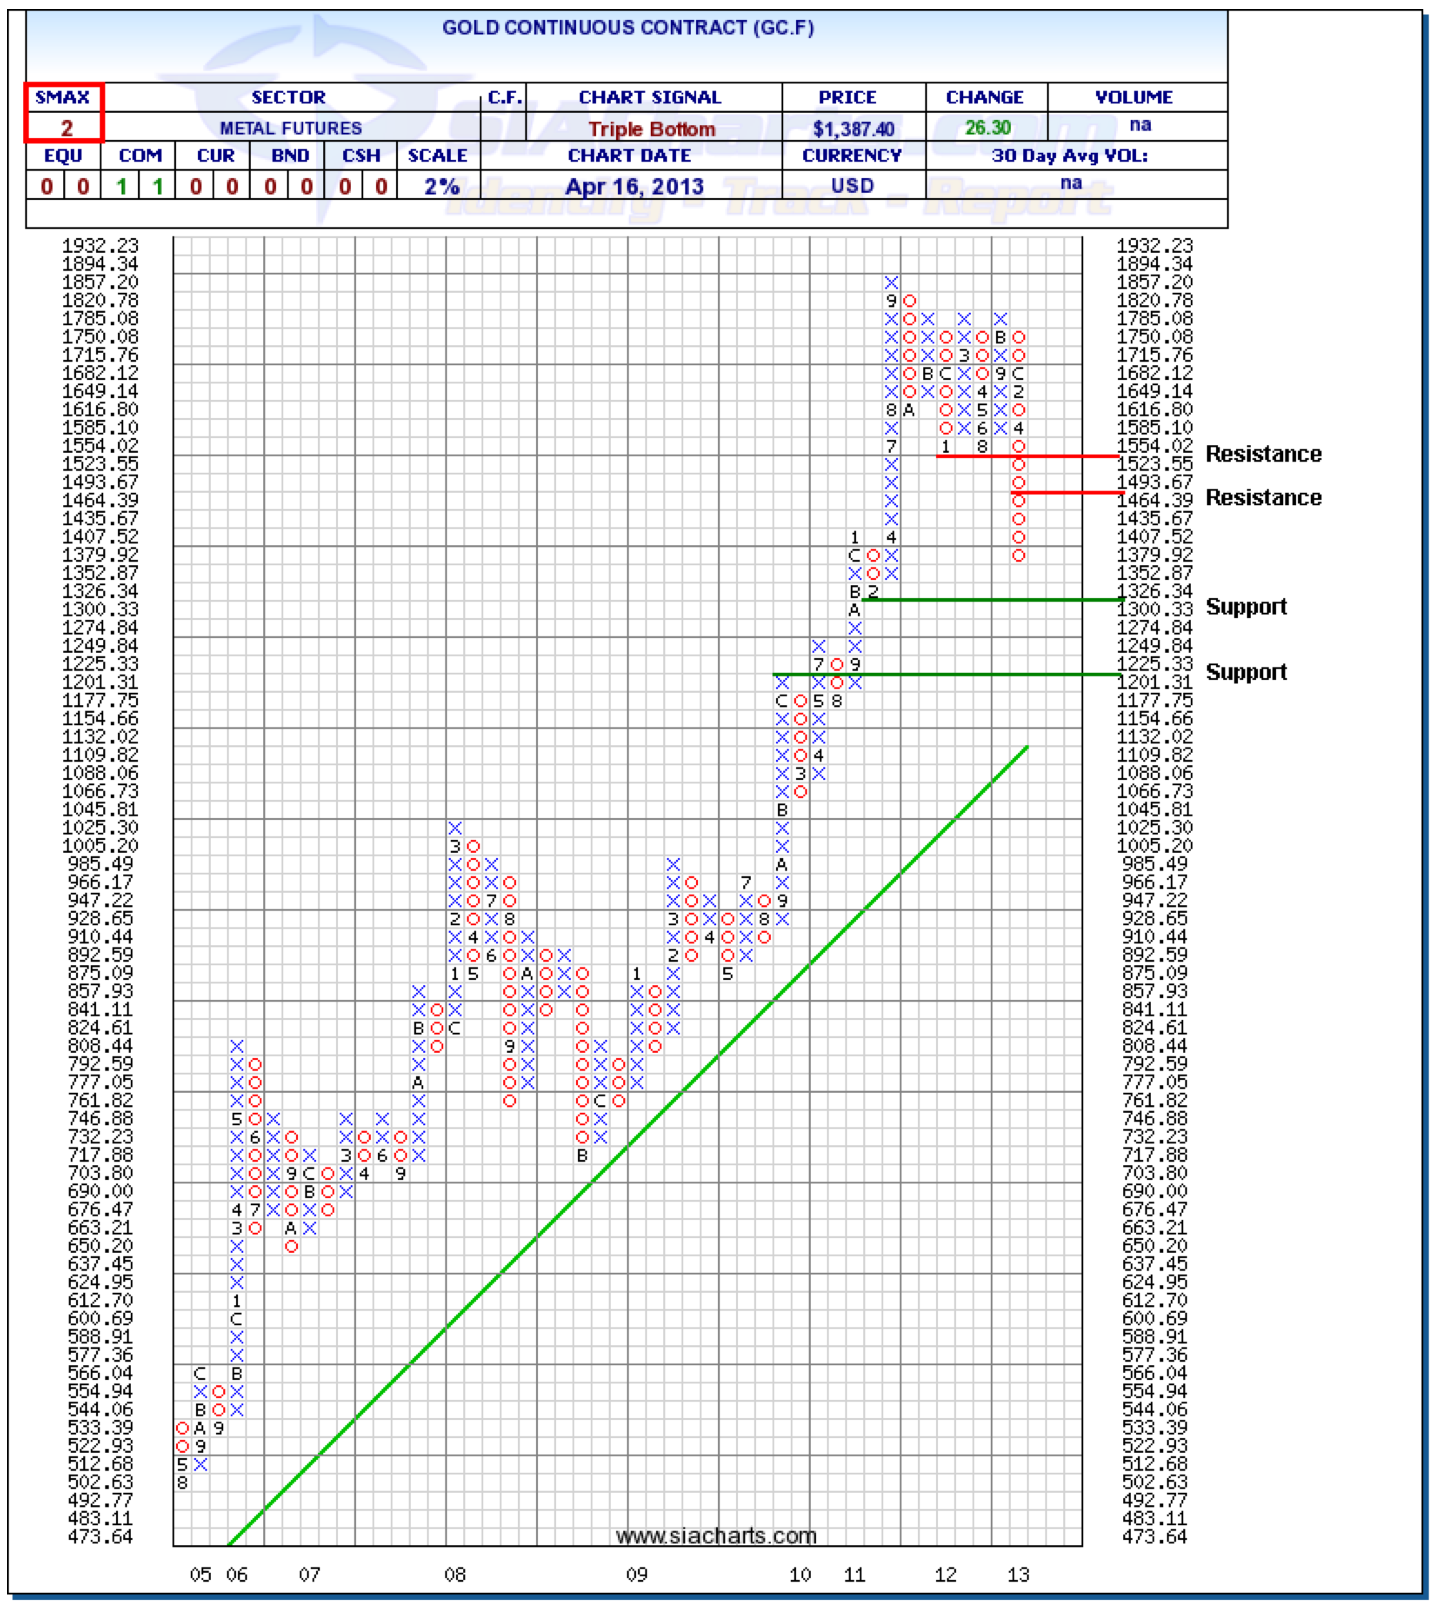
Silver Continuous Contract (SI.F)
Similar to Gold, Silver's weakness has continued on its downward move and taken an even bigger hit than Gold moving to 2-year lows. SI.F has broken through an upwards trendline that has been in place since May of 2009 and continues to weaken relative to other commodities and opportunities. Resistance can now be found at $25.45 and $27.55.
You can see in the Silver chart to the right that the downwards sloping black trendlines are providing even more information about the possible future downwards direction of the channel it is currently in. Support can be found next at $20.88, which is also the high from March of 2008. Further support can be found at $19.29. The near-term strength SMAX score is 1 out of 10 showing weakness against all asset classes.
Click on Image to Enlarge

Copyright © SIACharts.com


