For this week's SIA Equity Leaders Weekly we are going to take a look at a couple of Commodities that clients are always keeping a watchful eye out for, Crude Oil and Natural Gas. Although Commodities are still our bottom ranked Asset Class in the SIA Asset Allocation Model, we also understand that as a resource driven economy in Canada advisors are always discussing these assets.
Crude Oil Continuous Contract (CL.F)
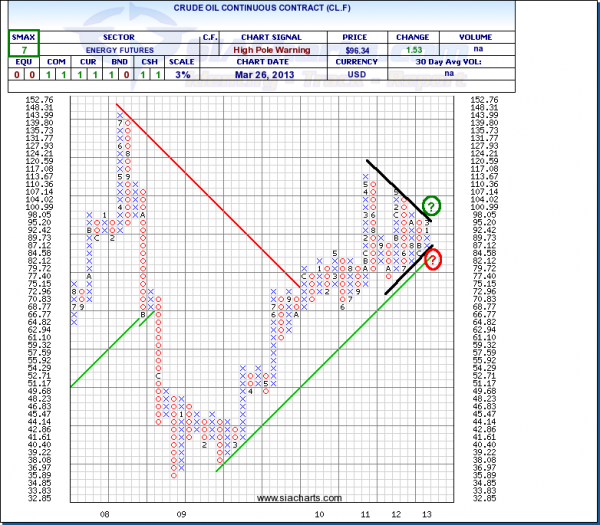
Looking at the chart of Crude Oil, in this case we have used a 3% chart to give us a little bit longer of an outlook so we can see that there is currently a tightening going on from the trendlines on both the top and the bottom. As this tightening continues the ultimate end result of this is likely going to be an explosive move in either a bullish or bearish direction. For those who are actively participating in Crude Oil, you may want to be tightening up your stop on the downside just in case.
Natural Gas Continuous Contract (NG.F)
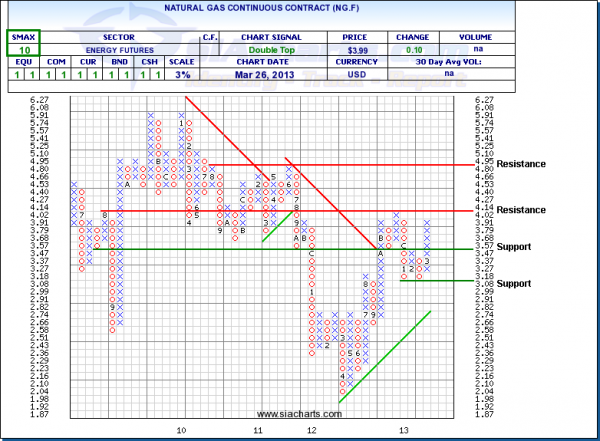
Again looking at the 3% chart, after an ugly second half of 2011 and the first half of 2012 where it eventually hit a low at $1.98, Natural Gas has now rebounded and has spent the last few months moving back and forth between the $3 and $4 level and is currently once again testing the top end of that level. A break above the resistance at $4.14 then gives Nat Gas plenty of potential room to move up to the $5 area. Support is now at $3.47 and again at $3.08. With the SMAX at 10, Natural Gas is currently showing strength against all the asset classes.
Both of these charts need to continue to be monitored for those holding positions in them as we could soon see some further movement in these that may be quite positive, or may be very negative.
*** for those interested, create a point and figure comparison chart between CL.F and NG.F to see who is currently winning the battle between these two Commodities.
Copyright © SIACharts.com


