


This is No Sugar High!
by James Paulsen, Wells Capital Management
March 5, 2013
The Federal Reserve’s continuous monetary accommodation since 2008 has created a widespread perception the almost full recovery of the stock market is simply an artificial “sugar high.” Many believe the stock market is vulnerable since it is not based on fundamentals, but rather is only being temporarily lifted by a constant liquidity drip and once the Fed ultimately disconnects the patient from its money IV, the stock market could tumble.
We disagree. First, “sugar” has not been nearly as sweet for the stock market in recent years compared to earlier post-war decades. Indeed, the correlation between money supply growth and stock prices has been negative since 2000. Second and most importantly, the performance of the overall stock market and the relative price performances of individual stock sectors appear to be more tied to “fundamental economic improvements.”
Recent discussions surrounding when and how aggressively the Fed may unwind monetary easing have caused unrest in the stock market. Undoubtedly, such concerns will bring yet more stock market volatility, but because this bull market is primarily fundamentally based, it is probably more sustainable and more impervious to the end of monetary assistance than most appreciate.
Sugar is not as sweet
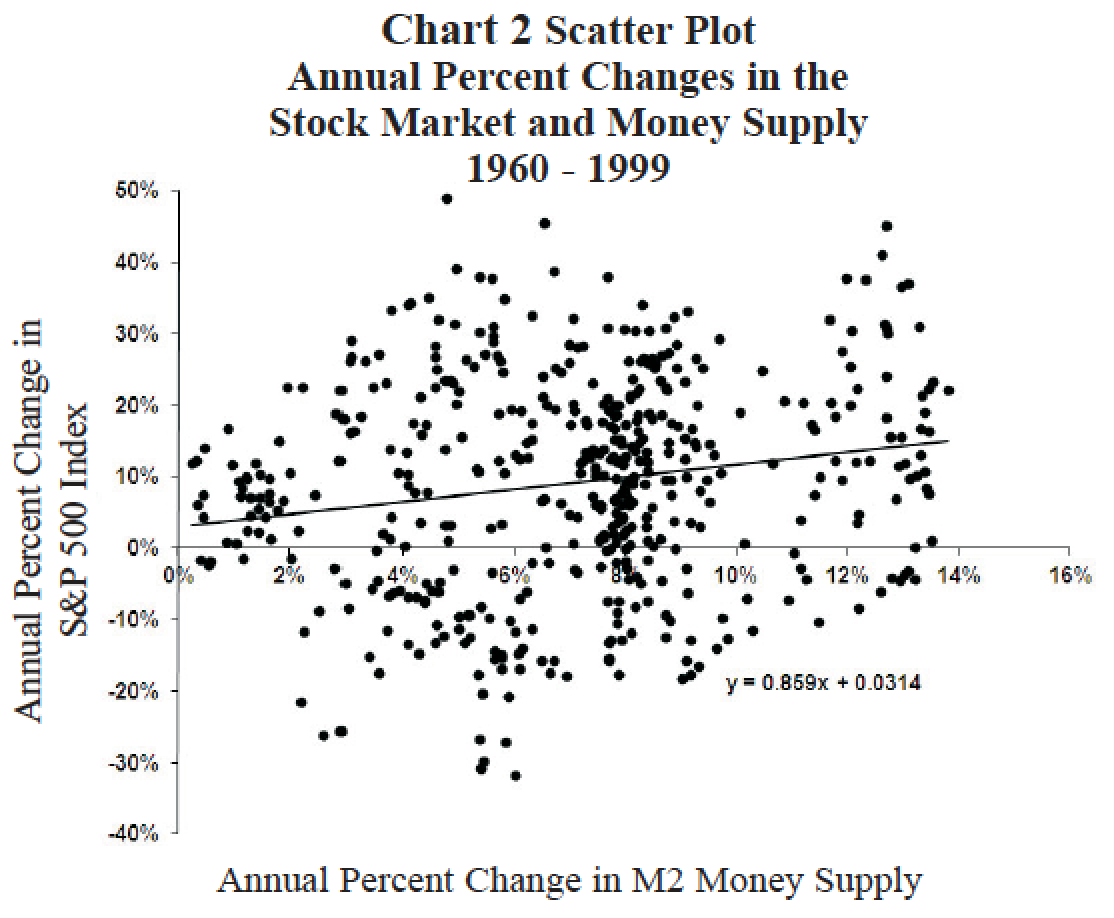
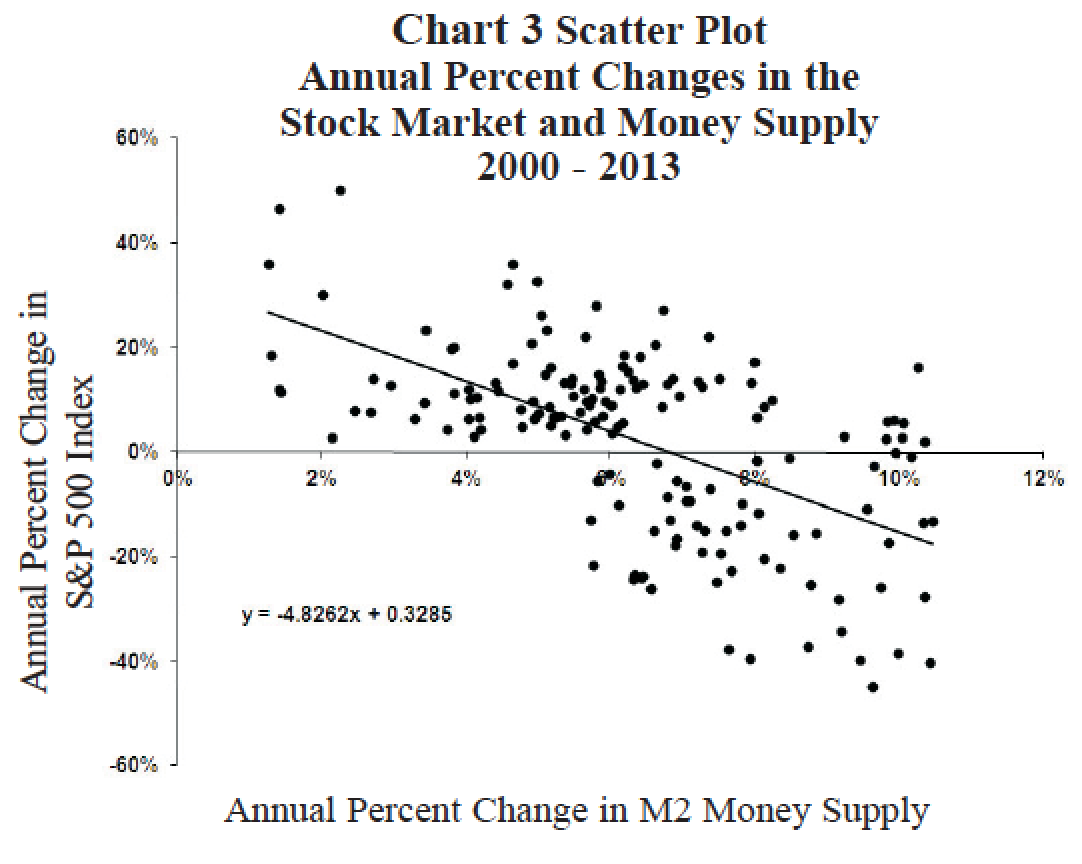
Excess economic liquidity (sugar) has typically been good for stock prices. However, as shown by the charts in Exhibit 1, the relationship between money supply growth and stock prices has changed in the last decade. Chart 1 shows the correlation between money growth and stock prices by decade since 1960. Between 1960 and 1999, faster money growth was associated with rising stock prices. However, since 2000 (and particularly since the contemporary recovery began in 2009), stock prices and money growth have surprisingly been “negatively” correlated.
Charts 2 and 3 in Exhibit 1 show the scatter plots between annual money supply growth rates and annual growth rates in the stock market for the periods between 1960 and 1999 and since 2000. The solid line on each chart illustrates the estimated trendline relationship suggested by the scatter plot. Until 2000, faster money growth was usually a positive for the stock market. Since 2000, however, the relationship is much less defined and indeed suggests slower rather than faster monetary growth may be best for the stock market.
We are not sure why the recent correlation between the money supply and the stock market has changed so dramatically. However, in contrast to earlier decades, the recent correlation between sugar and stock prices suggests the stock market may fare much better than most expect as the Fed begins to normalize monetary policy.
Stock market following ‘fundamentals’
The charts in Exhibit 2 illustrate the underlying “fundamental nature” of the contemporary stock market rally. As shown in Chart 1, throughout this recovery, the stock market has closely followed the revival in corporate profits! Does it get anymore ‘fundamental’ than this? Rather than an unsustainable sugar high, the current stock market is best portrayed by a very traditional, fundamental, profit-led bull market. Indeed, contrast the fundamental nature of the contemporary stock market rally with the stock market run between 1996 and 2000. Then, the stock market exhibited a much frothier and unsustained character when stock prices became entirely divorced from profit fundamentals.
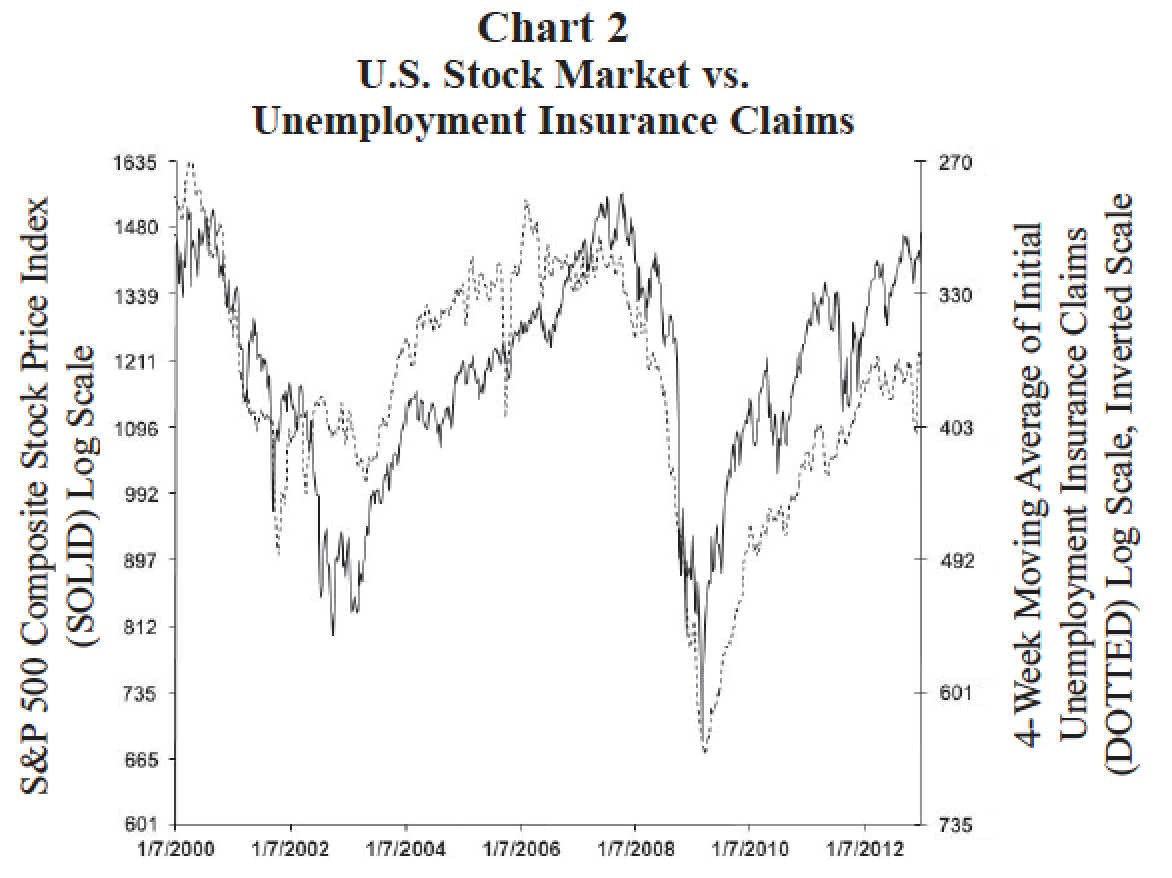
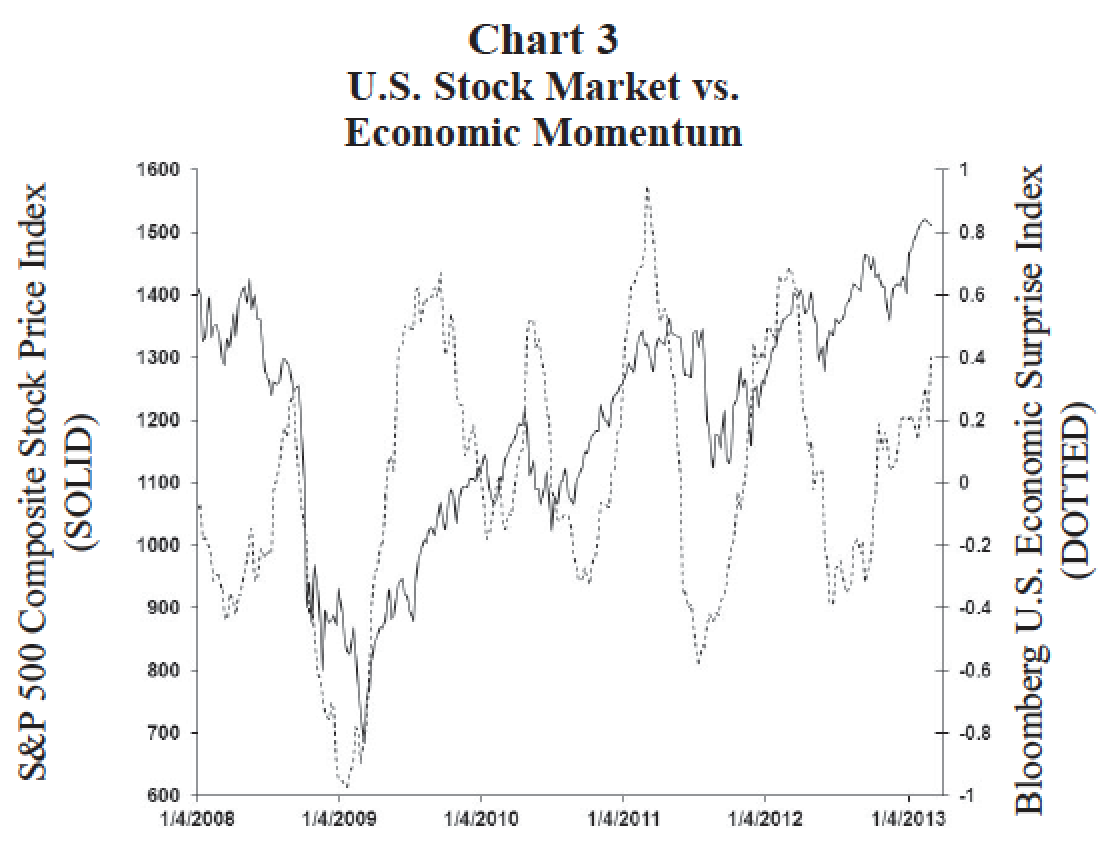
Chart 2 shows how stock prices also reflect the fundamental revival in the U.S. job market. Since 2000, stock price movements have closely mirrored changes in employment health and most recently this has been exemplified by declining weekly jobless insurance claims. Finally, Chart 3 shows that the volatility of stock prices throughout this recovery has been closely related to changes in overall ‘fundamental’ U.S. economic momentum.
The contemporary stock market recovery is not a crazy, disconnected-from-reality bull market as it is often portrayed. Stock prices are not nearing all-time record highs simply because of continuous liquidity injections from the Fed. As the charts in Exhibit 2 suggest, the contemporary bull market is much more fundamentally driven than widely appreciated. Stock prices are nearing new all-time highs because of a solid revival in corporate profits, because of fundamental improvements in the U.S. job market and because of improved and broadening momentum exhibited by the U.S. economic recovery. Sector performance also reflects fundamental improvements
The fundamental underpinnings of this bull market are also characterized by the individual sector performances within the stock market. Exhibit 3 relates the relative stock price performances of various stock market sectors to specific fundamental improvements.
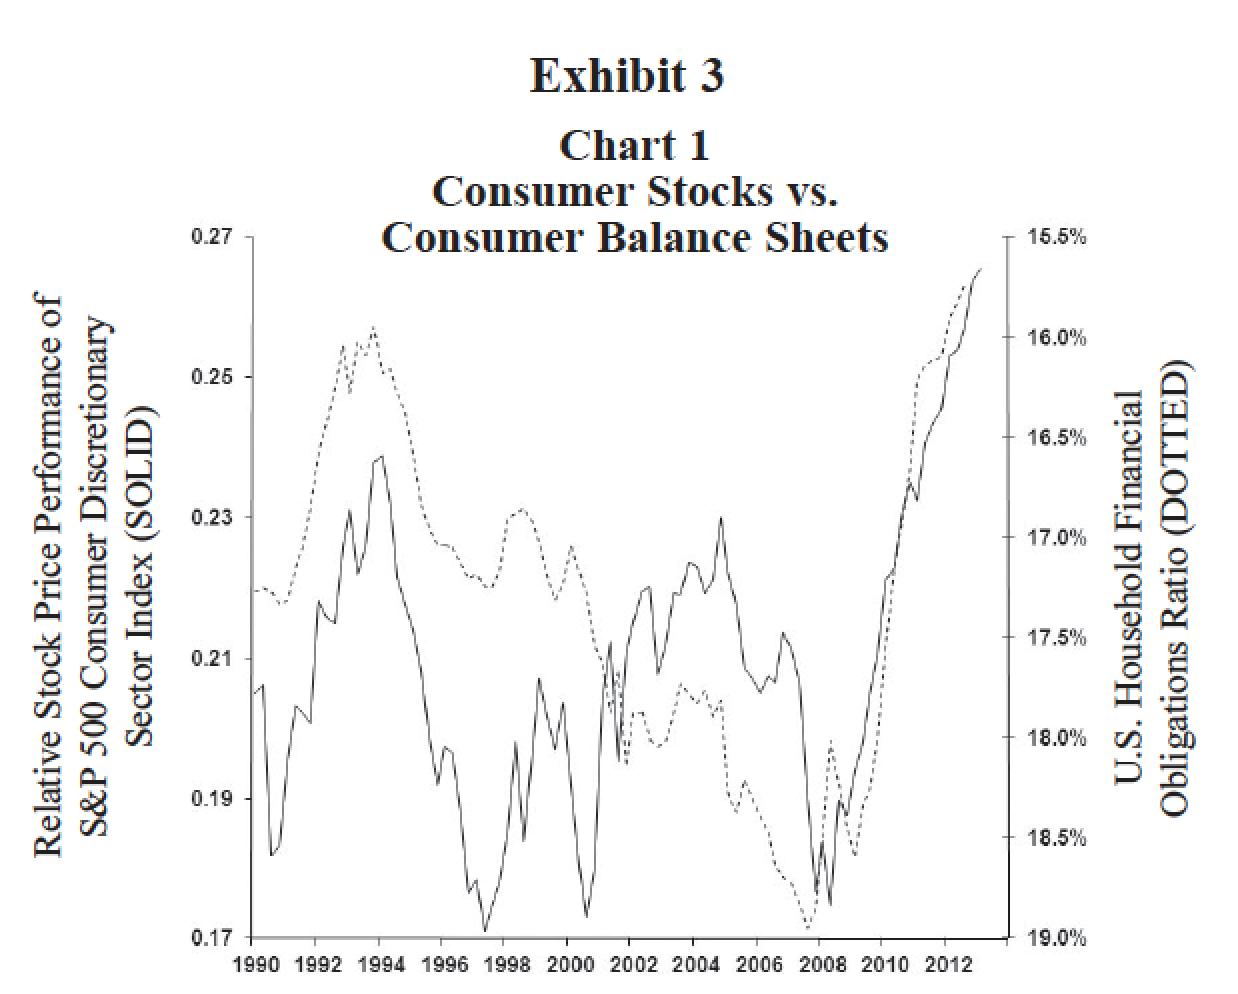
Chart 1 overlays the relative price performance of the S&P 500 consumer discretionary sector with the U.S. household debt service burden (i.e., U.S. household financial obligations ratio). The debt service burden of the household sector (dotted line, right inverted scale) has declined from a record high in 2007 to near a record low. Consumer discretionary stocks have almost continuously outpaced during this recovery reflecting persistent improvements in household balance sheets. ‘Fundamental’ household economic improvements have caused the consumer discretionary sector to be the best performing sector of the recovery.
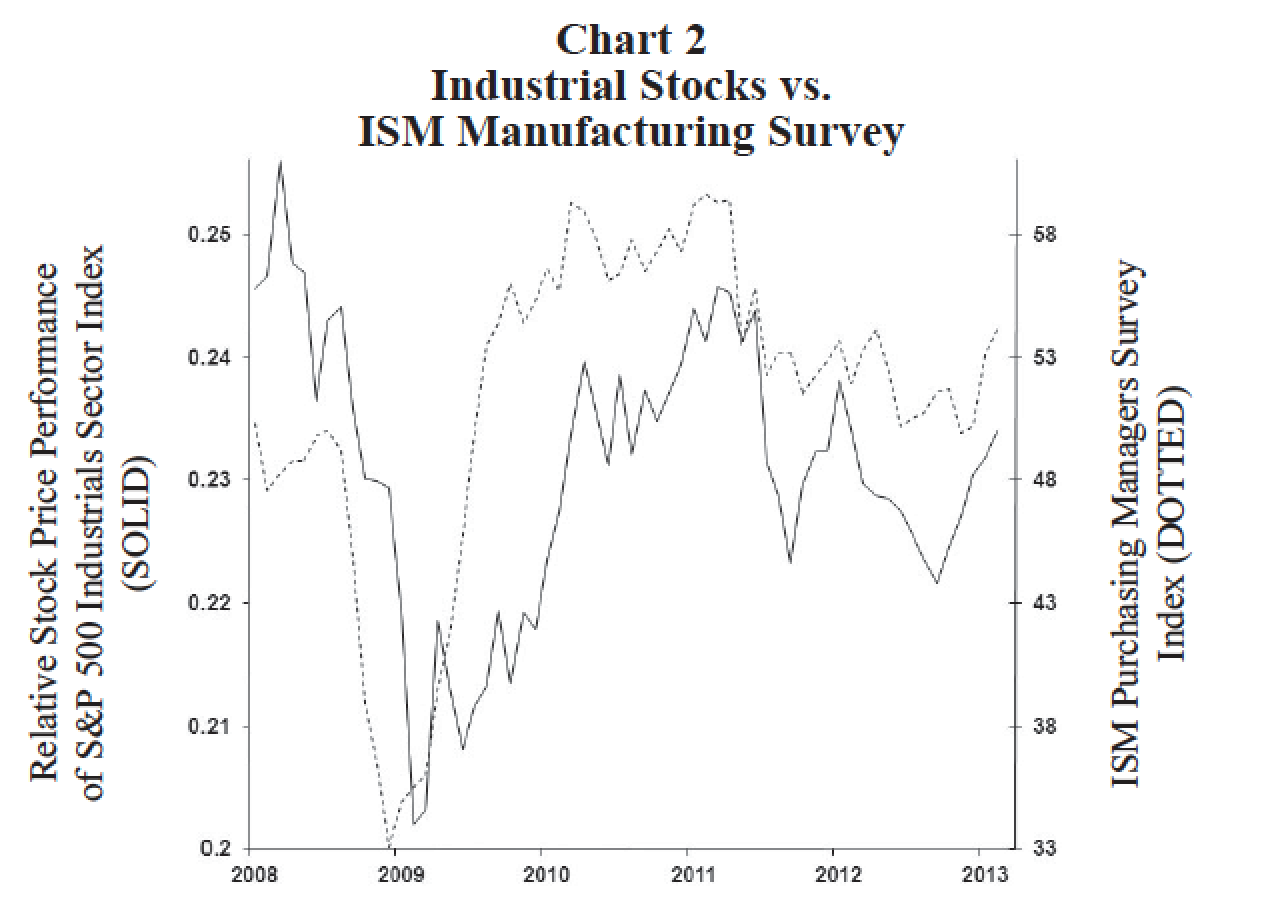
Similarly, a sugar high cannot be found in Chart 2 which compares the relative price of the S&P 500 industrial sector to the monthly ISM manufacturing survey index. Although not a perfect relationship, the ebb and flow in the performance of industrial stocks has been tied closely to the ebb and flow of fundamental industrial economic performance in this recovery.
Chart 3 illustrates a primary fundamental improvement (i.e., bank lending) which has recently revived financial stock performance. After a sharp but brief recovery in 2009 from the 2008 crisis, the relative performance of the S&P 500 financial sector has closely mirrored the trend in bank loans. Between the end of 2009 until the end of 2011, financial stocks regularly underperformed as bank loans continued to decline. However, since late 2011 bank loans began a persistent ‘fundamental’ recovery causing financial stocks to be among the best performing sectors last year. For financial stocks, what represents a more fundamental positive force than a revival in credit creation?
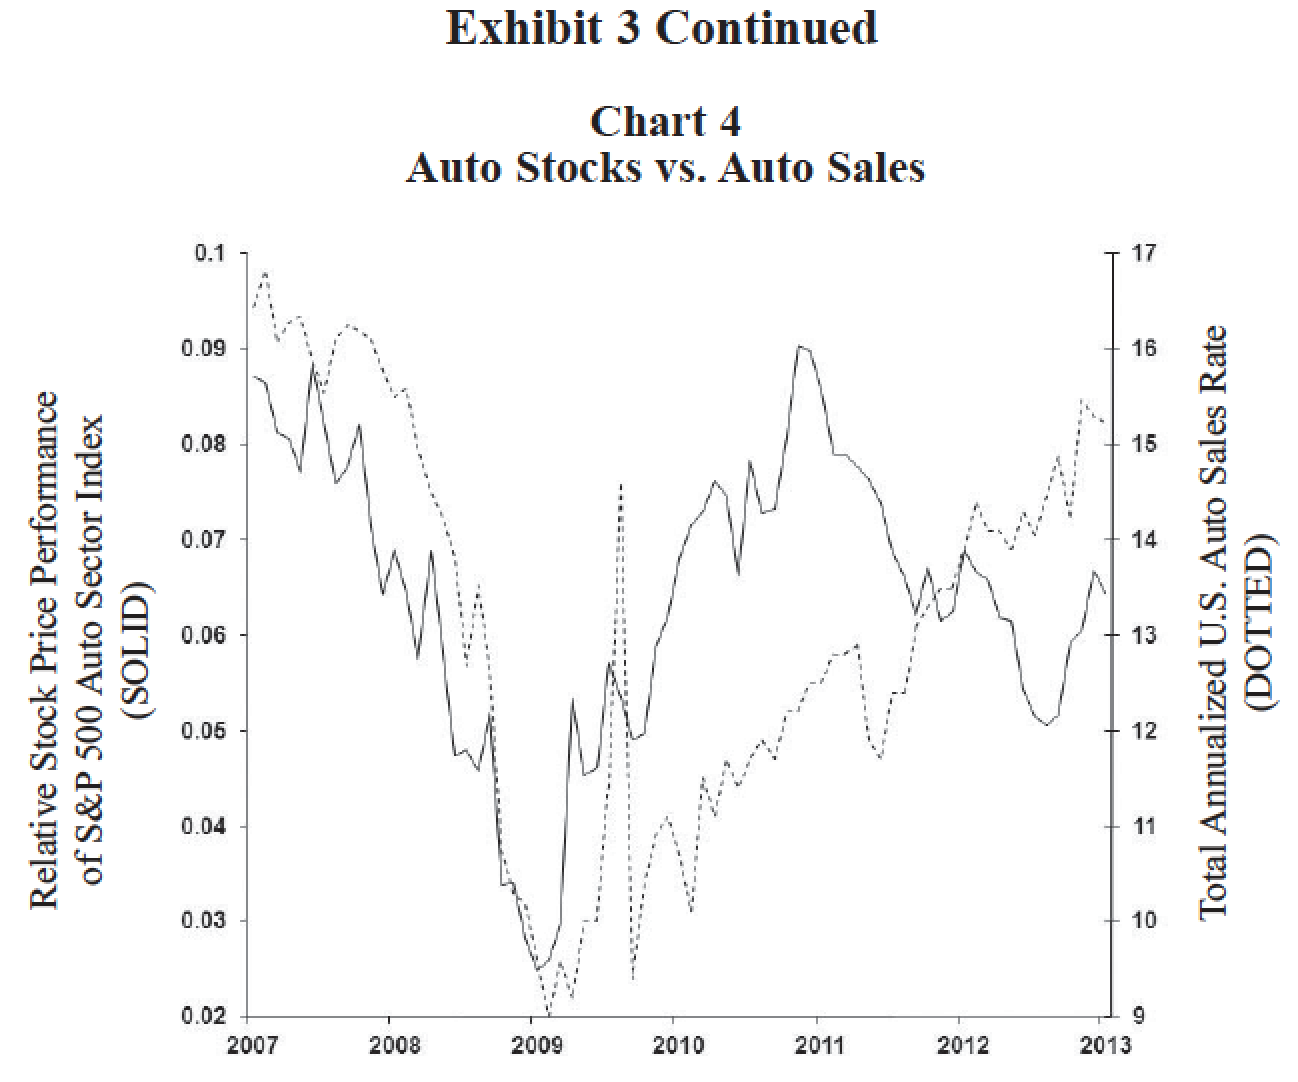
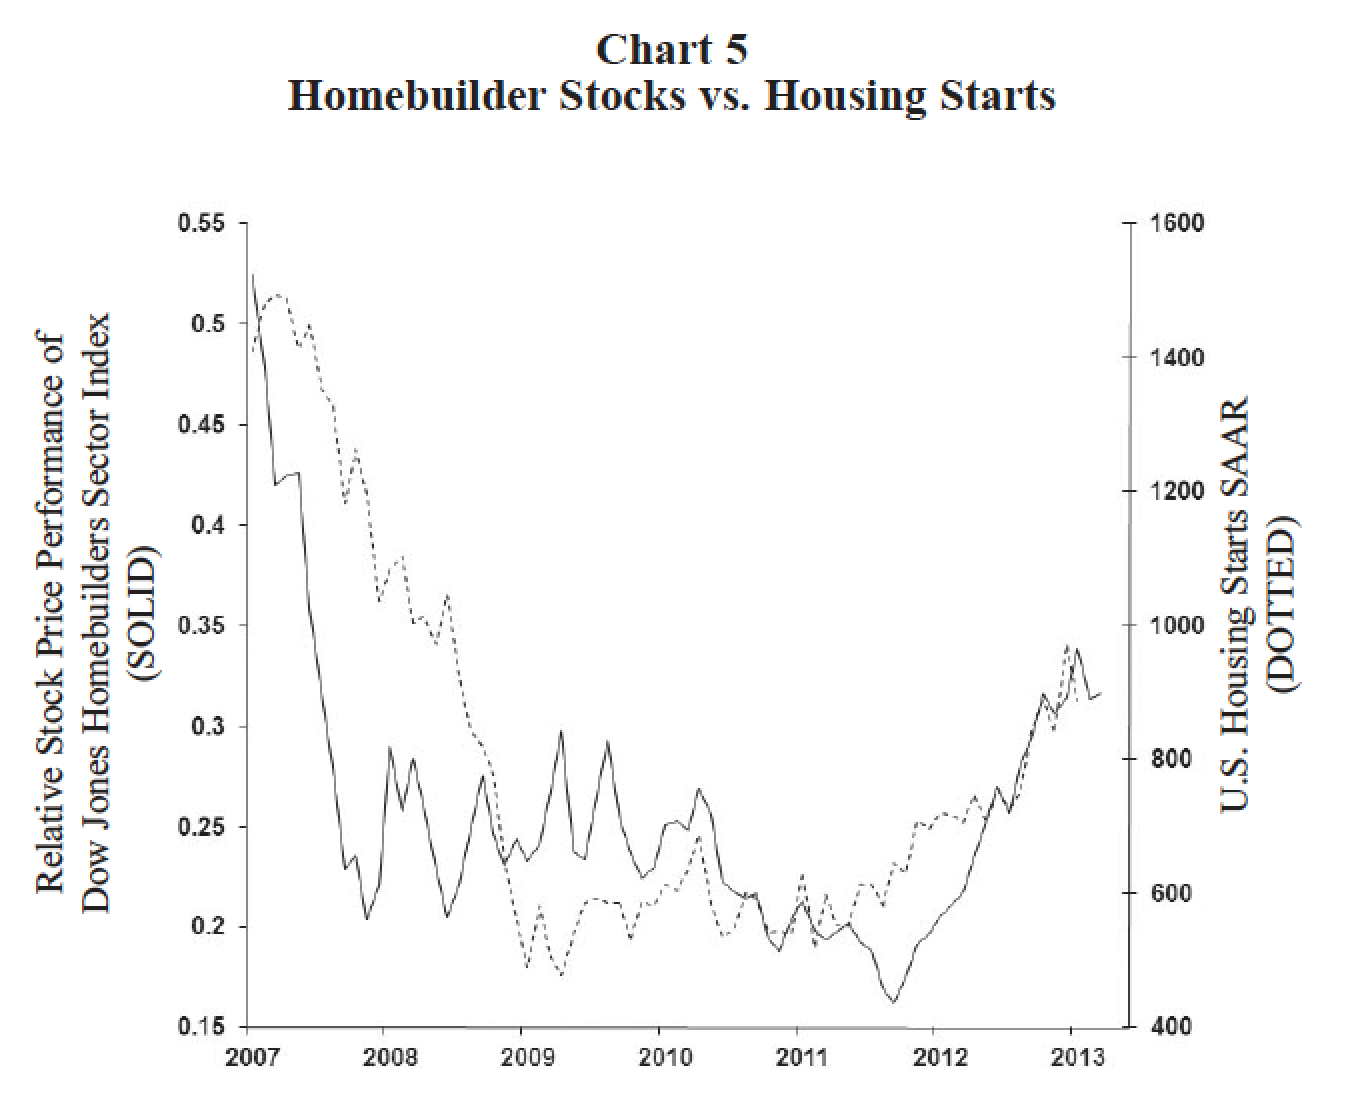
Finally, Charts 4 and 5 show the relative stock price performances of two major economic industries (cars and homes) have been driven by fundamental sales revivals in these two industries. The relative stock price performance of auto companies has done well throughout since auto sales began improving almost immediately once the recovery started in early 2009. By contrast, the performance of homebuilder stocks has been poor until the last year when “real housing activity” finally rejuvenated.
Summary
Many believe the stock market is at the mercy of the Federal Reserve. As the national conversation surrounding how and when the Fed will reverse its massive monetary easing campaign heats up, so are fears surrounding the vulnerability of this “sugar high” stock market.
Don’t be overly alarmed by chatter the Fed is about to take the punch bowl away. Certainly, as the Fed moves to normalize monetary policy, it will create some additional volatility in the stock market. However, moving away from a crisis-like monetary policy will not likely end this bull market. First, “sugar” just isn’t as sweet or as important to the stock market in the last several years as it was historically. Consequently, slower liquidity growth (particularly when there is so much liquidity in excess anyway) will not likely have as much impact on stock prices as is widely feared.
Most importantly, however, is the realization this bull market has been predominately the result of ‘fundamental’ improvements and not, as most seem to believe, simply a creation of the Fed. Just a few examples of improvements in the fundamental landscape during this recovery include U.S. households have experienced an almost full recovery of net worth, the household debt service burden is back near a record low, the unemployment rate has recently been declining at its fastest pace of the recovery, household job creation averaged a solid 200,000 monthly in 2012, consumer confidence has recently surged to a five-year high, total U.S. corporate profits are already at an all-time record high almost 20 percent above the peak of the last recovery cycle, U.S. bank loans have been rising steadily again since late 2011, housing activity and home prices have been rising again in the last year, auto sales have recovered to almost a 15.5 million annual pace, total state tax collections recently reached a new all-time high, corporate balance sheets have seldom been stronger, and the largest U.S. banks are again well capitalized.
Rather than a sugar high orchestrated by the Fed, this bull market appears much more like a ‘fundamental high’ driven by a revival in private economic activities.


Copyright © Wells Capital Management


