Upcoming US Events for Today:
- The Chicago Fed National Activity Index will be released at 8:30am.
- Dallas Fed Manufacturing Index for February will be released at 10:30am. The market expects 4.0 versus 5.5 previous.
Upcoming International Events for Today:
- China Flash Manufacturing PMI, released on Sunday at 8:45pm EST. The market expected 52.2 versus 52.3 previous.
The Markets
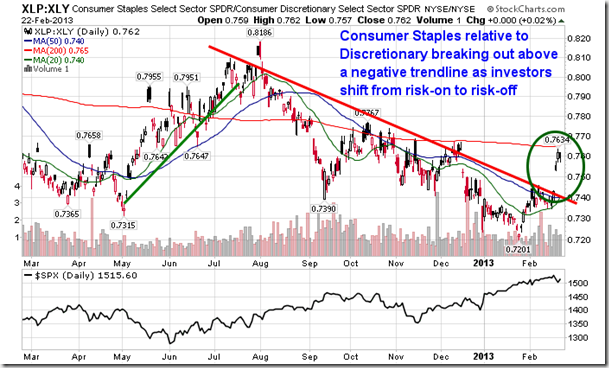
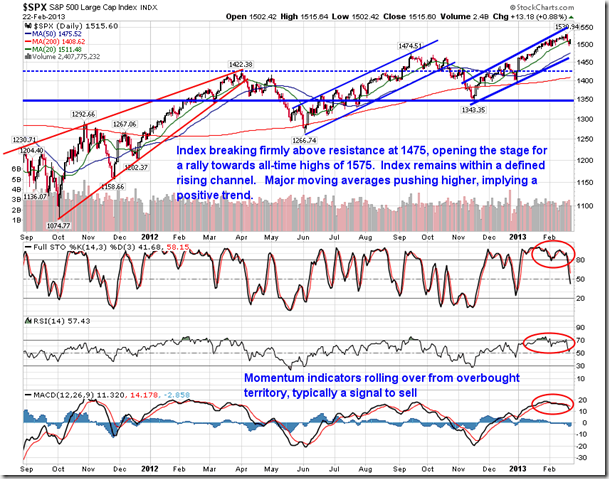
Equity markets gained on Friday, rebounding from recent losses that stemmed from the latest meeting minutes out of the US Fed. Minutes released Wednesday indicated that current monetary easing initiatives may not run for the indefinite period that inventors had previous thought. Stocks posted sharp declines over a two-day period, following the negative trading activity in the commodity market that saw significant declines in a number of the metals. Gold is now down 5.11% for the month of February, while Silver has posted declines of 8.85%. Despite all of the volatility, the S&P 500 ended lower by a mere 0.28% for the week. The Nasdaq fared slightly worse, posting declines of 0.95% over the holiday shortened period, while the Dow Jones Industrial Average actually ended marginally positive with a gain of 0.13%. Top performing sectors on the week were Consumer Staples (up 1.73%) and Utilities (up 1.25%). Worst performing sectors were Materials (down 2.85%) and Consumer Discretionary (down 1.43%). Outperformance in the defensive sectors is a classic sign of risk aversion as investors take profits in high beta cyclical assets and rotate into lower beta alternatives. This risk aversion is clear in the ratio of Consumer Staple stocks relative to Consumer Discretionary, which broke above a down trendline last week as investors flip from being risk-on to risk-off.
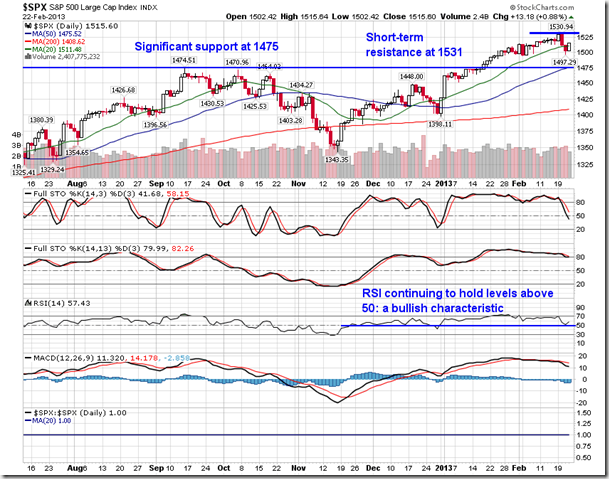
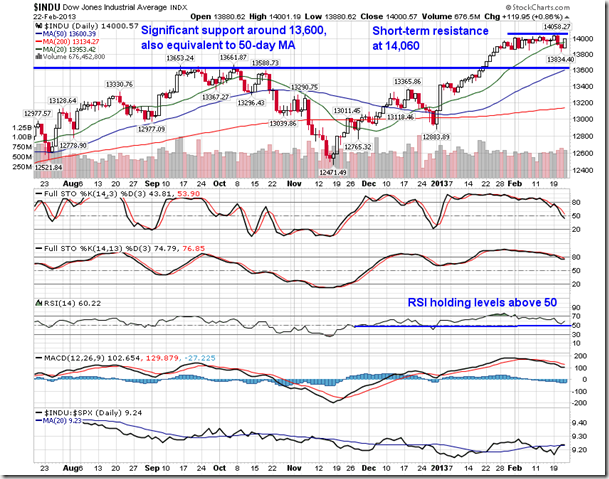
Recent declines have defined short-term levels of resistance close overhead. On the S&P 500, the recent high of 1531 becomes the hurdle level in order to maintain the positive intermediate trend, while on the Dow Jones Industrial Average that level is around 14,060. On Friday the S&P 500 showed the significance of psychological support at 1500, bouncing definitively from this level to close out the week. Significant support still exists slightly lower around 1475, representing the recent breakout level to new multi-year highs and also now matching the 50-day moving average. The RSI is showing signs of rebounding from the 50 level, a characteristic of a bullish market trend. RSI rolled over from significantly overbought levels above 70 at the end of January and has since alleviated this overbought state.
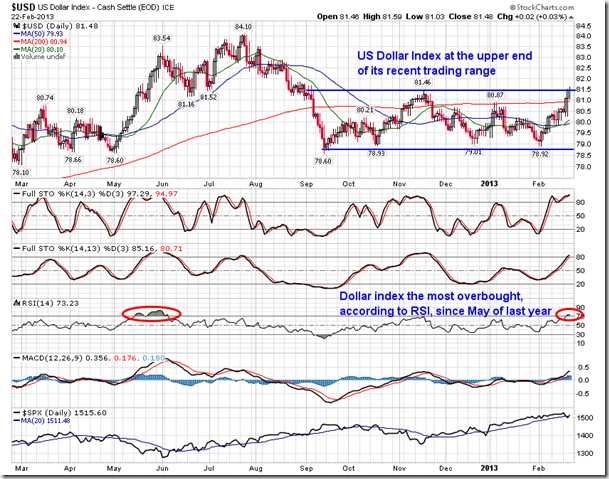
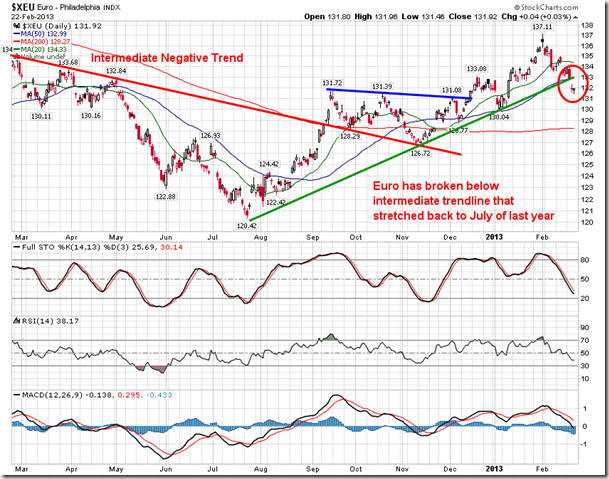
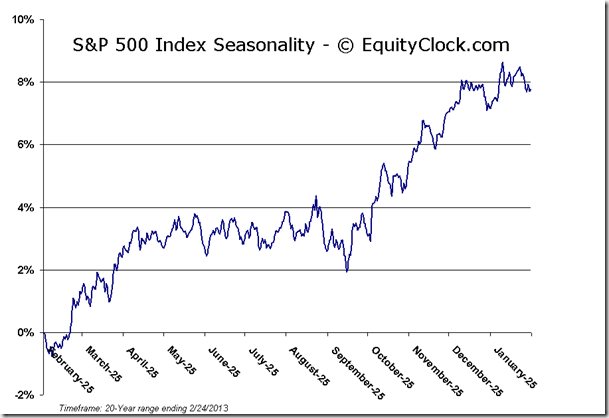
One of the factors for the weakness in equity and commodity markets last week was the rise of the US Dollar. The US Dollar index traded to the upper limit of its multi-month trading range, pressuring assets denominated in the currency lower. The Dollar index is now the most overbought since May of last year, suggesting an increased probability of some sort of retracement of recent gains. The gains in the US Dollar index last week came as a result of weakness in the Euro, which broke an intermediate rising trendline that stretched back to July of last year, coincidentally around the same time the market turned bullish. Weakness in the Euro below 1.33 and strength in the US Dollar Index above 81.50 would suggest further significant weakness in stocks and commodities. The US Dollar index seasonally peaks in the month of March.
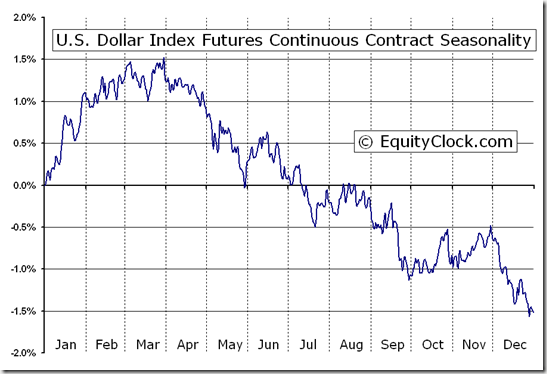
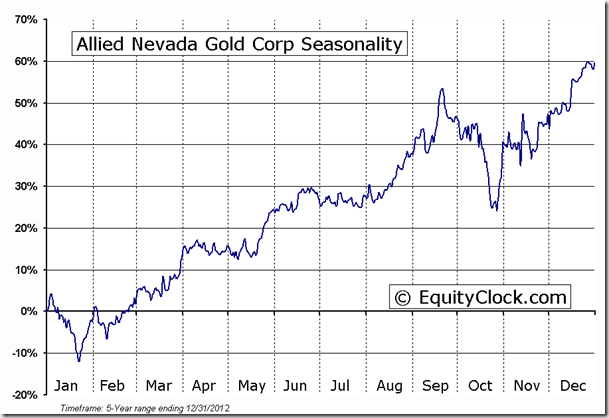
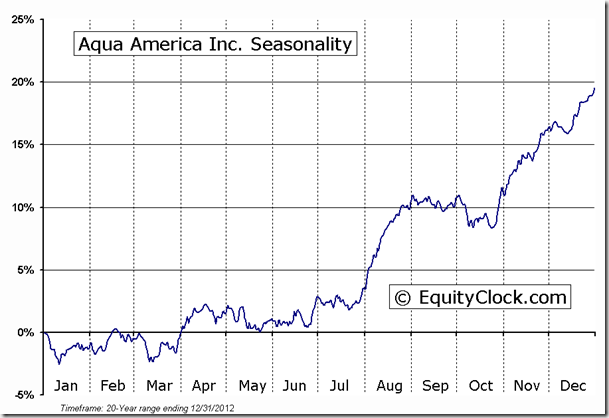
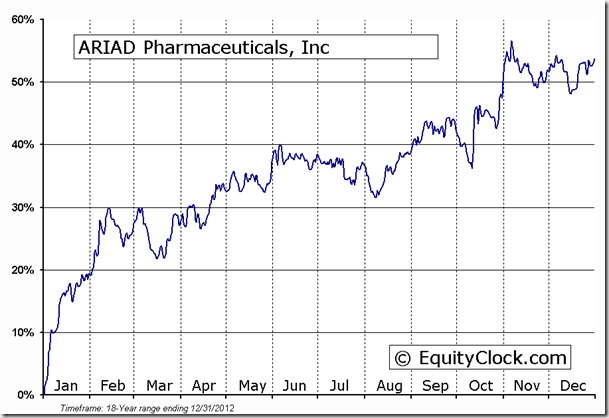
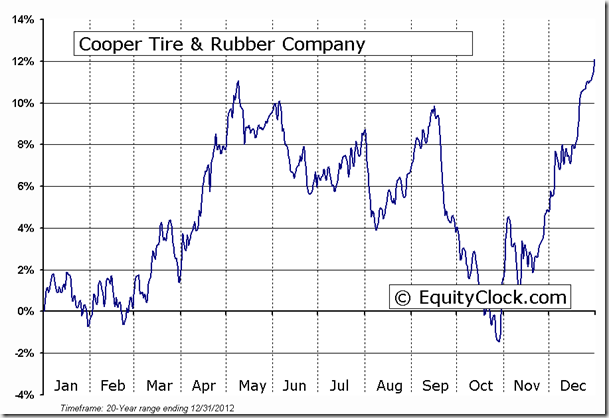
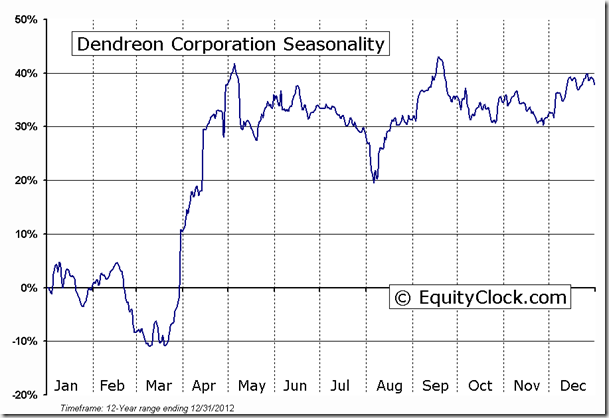
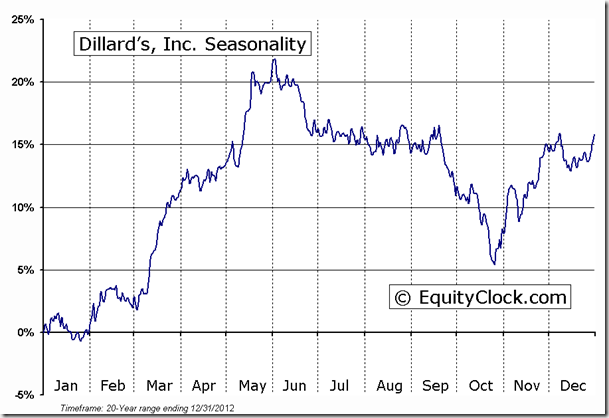
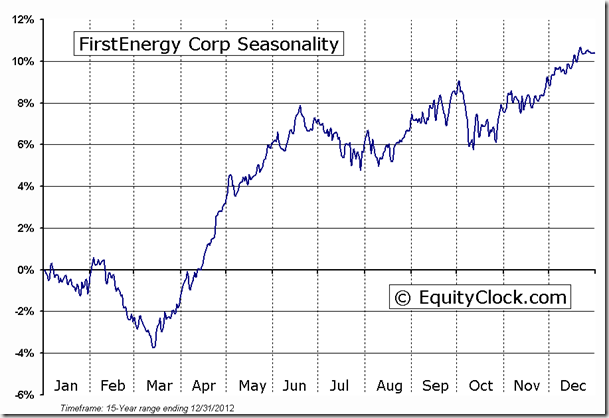
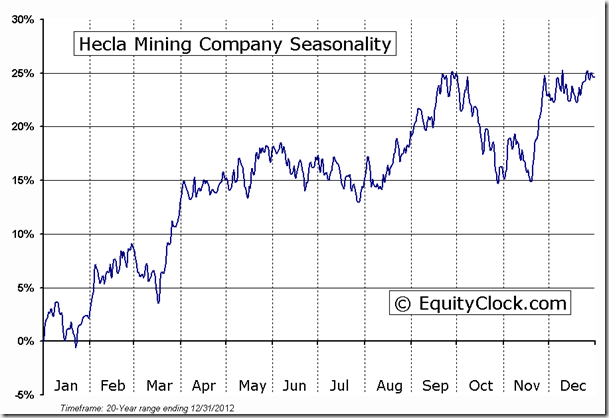
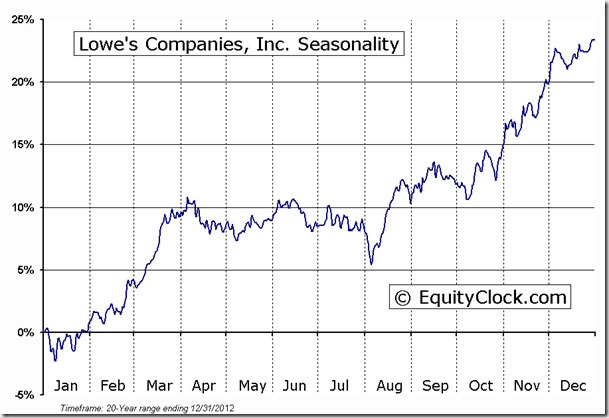
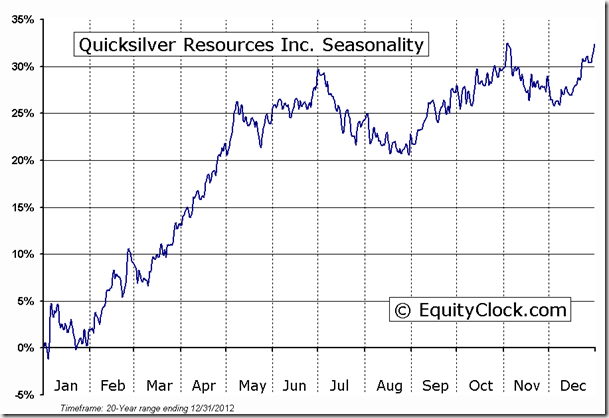
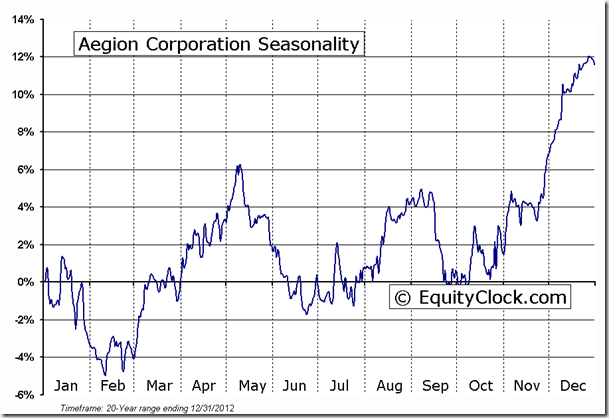
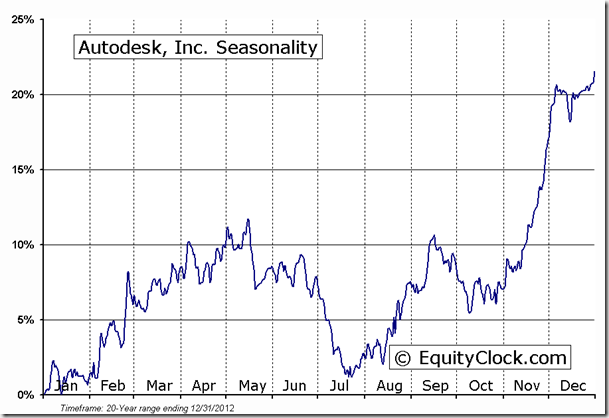
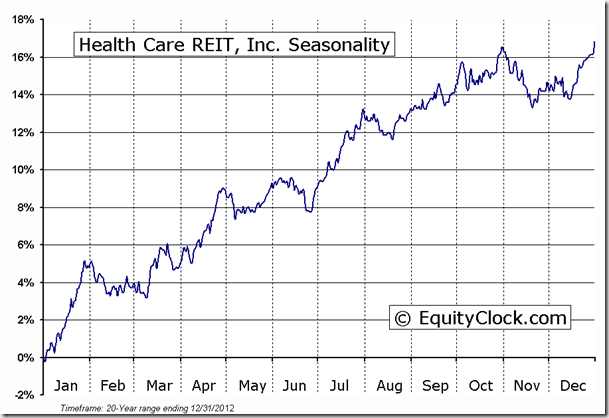
Seasonal charts of companies reporting earnings today are as follows:
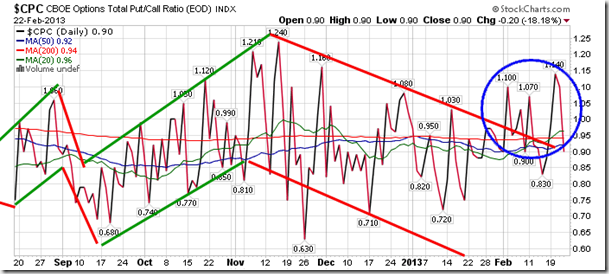
Sentiment on Friday, as gauged by the put-call ratio, ended bullish at 0.90.
Chart Courtesy of StockCharts.com
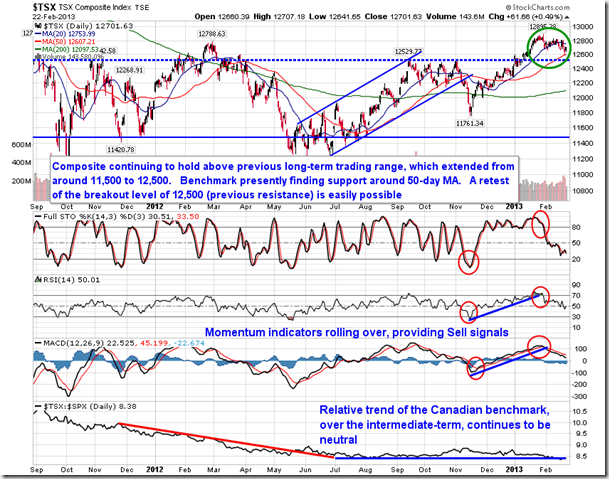
Chart Courtesy of StockCharts.com
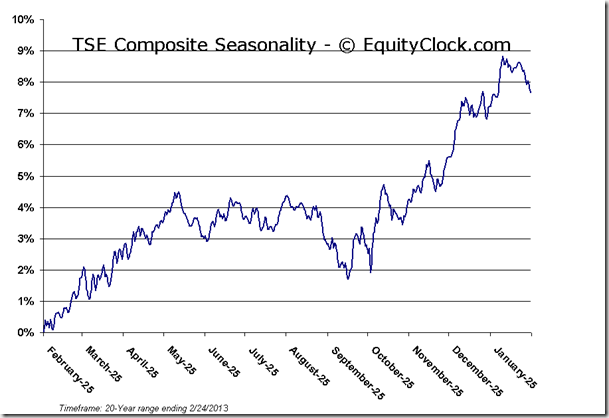
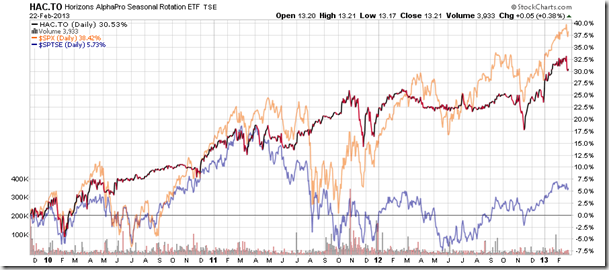
Horizons Seasonal Rotation ETF (TSX:HAC)
- Closing Market Value: $13.21 (up 0.38%)
- Closing NAV/Unit: $13.22 (up 0.63%)
Performance*
| 2013 Year-to-Date | Since Inception (Nov 19, 2009) | |
| HAC.TO | 3.94% | 32.2% |
* performance calculated on Closing NAV/Unit as provided by custodian
Click Here to learn more about the proprietary, seasonal rotation investment strategy developed by research analysts Don Vialoux, Brooke Thackray, and Jon Vialoux.


