


For this week's edition of the SIA Equity Leaders Weekly we are going to relook at the Canadian Equity markets, specifically the S&P/TSX Composite Index to see what we can expect going forward. We also want to help answer the question of "can you still find dividend stocks in Canada that have growth potential"? To do this, we will focus in on Telus Communications as an example of how to utilize SIA's Relative Strength technology to find consistent winners that pay out dividends that more and more people are looking for.
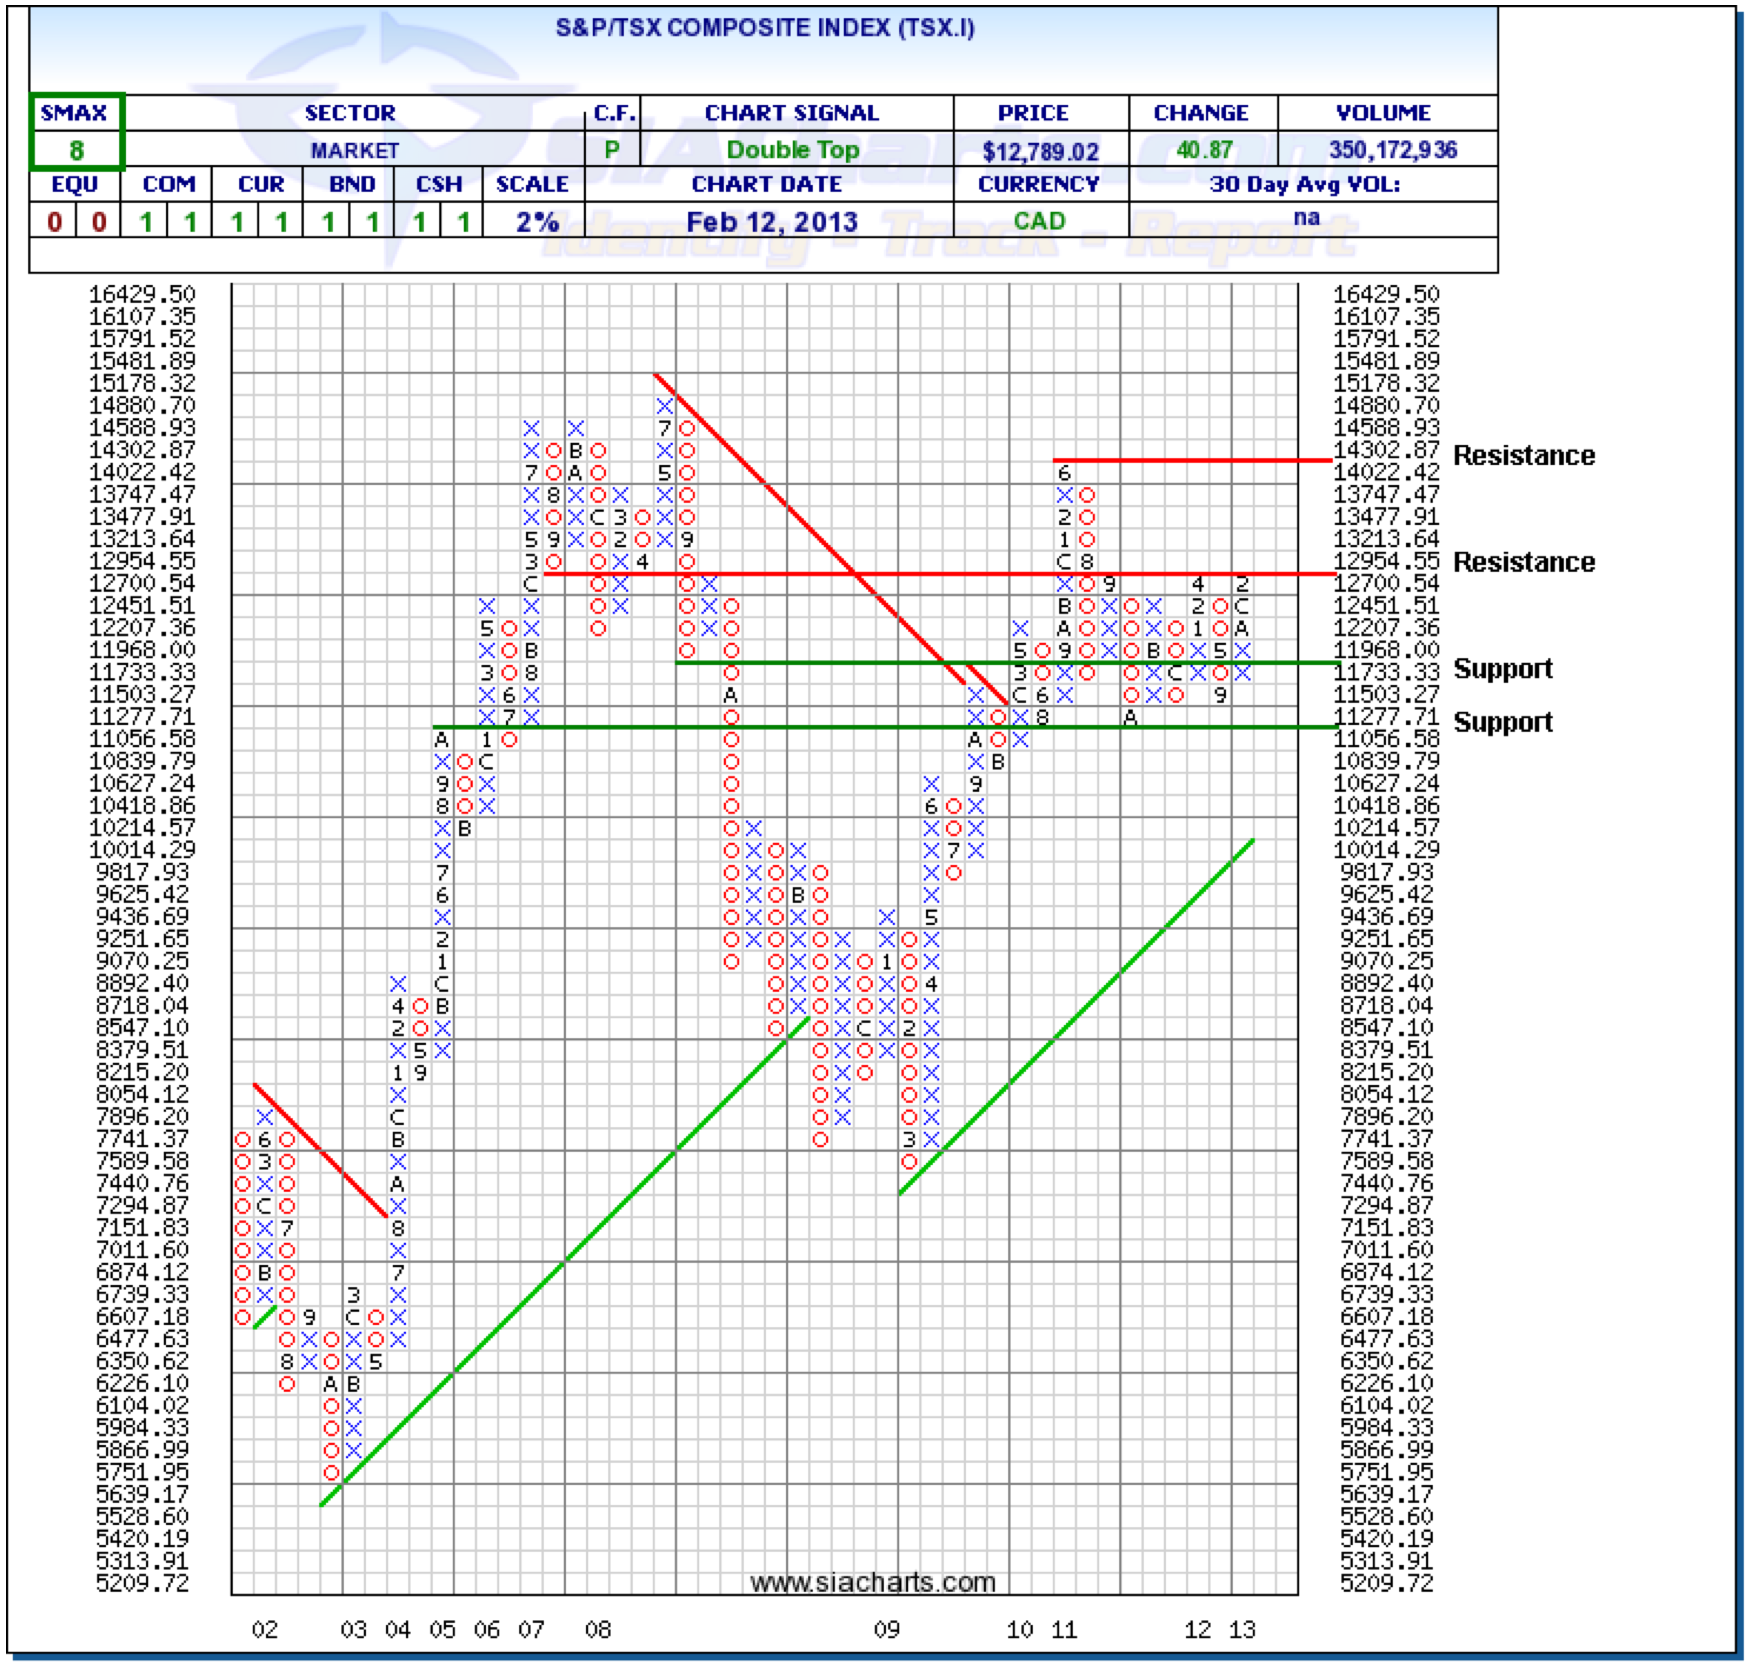
S&P/TSX Composite Index (TSX.I)
The S&P/TSX Composite Index has basically been flat since August 31, 2011, (closed at 12768.70) and over the past 18 months has been stuck in a channel unlike the U.S. Equity benchmark we looked at last week which is up around 25% over the same time period. The TSX.I is now up against resistance at 12954.55, a level it also failed to move above in April of 2012. We last looked at the TSX.I at the beginning of the year where the major change we see between the two charts now is that the SMAX score (near-term indicator) has strengthened from a 4 to an 8 giving a better outlook than before that it could move above resistance and re-challenge the high from June of 2010 at 14302.87.
If it fails to move out of the channel it has been in for the past 18 months, support can be found at 11733.33 and at the bottom of the channel at 11056.58. It will be important to see if resistance at 12954.55 holds or if on this attempt it can break through to the upside to then give it some potential room to move.
Click on Image to Enlarge
Can You Still Find Good Dividend Paying Equities?
Telus Corporation (T.TO)
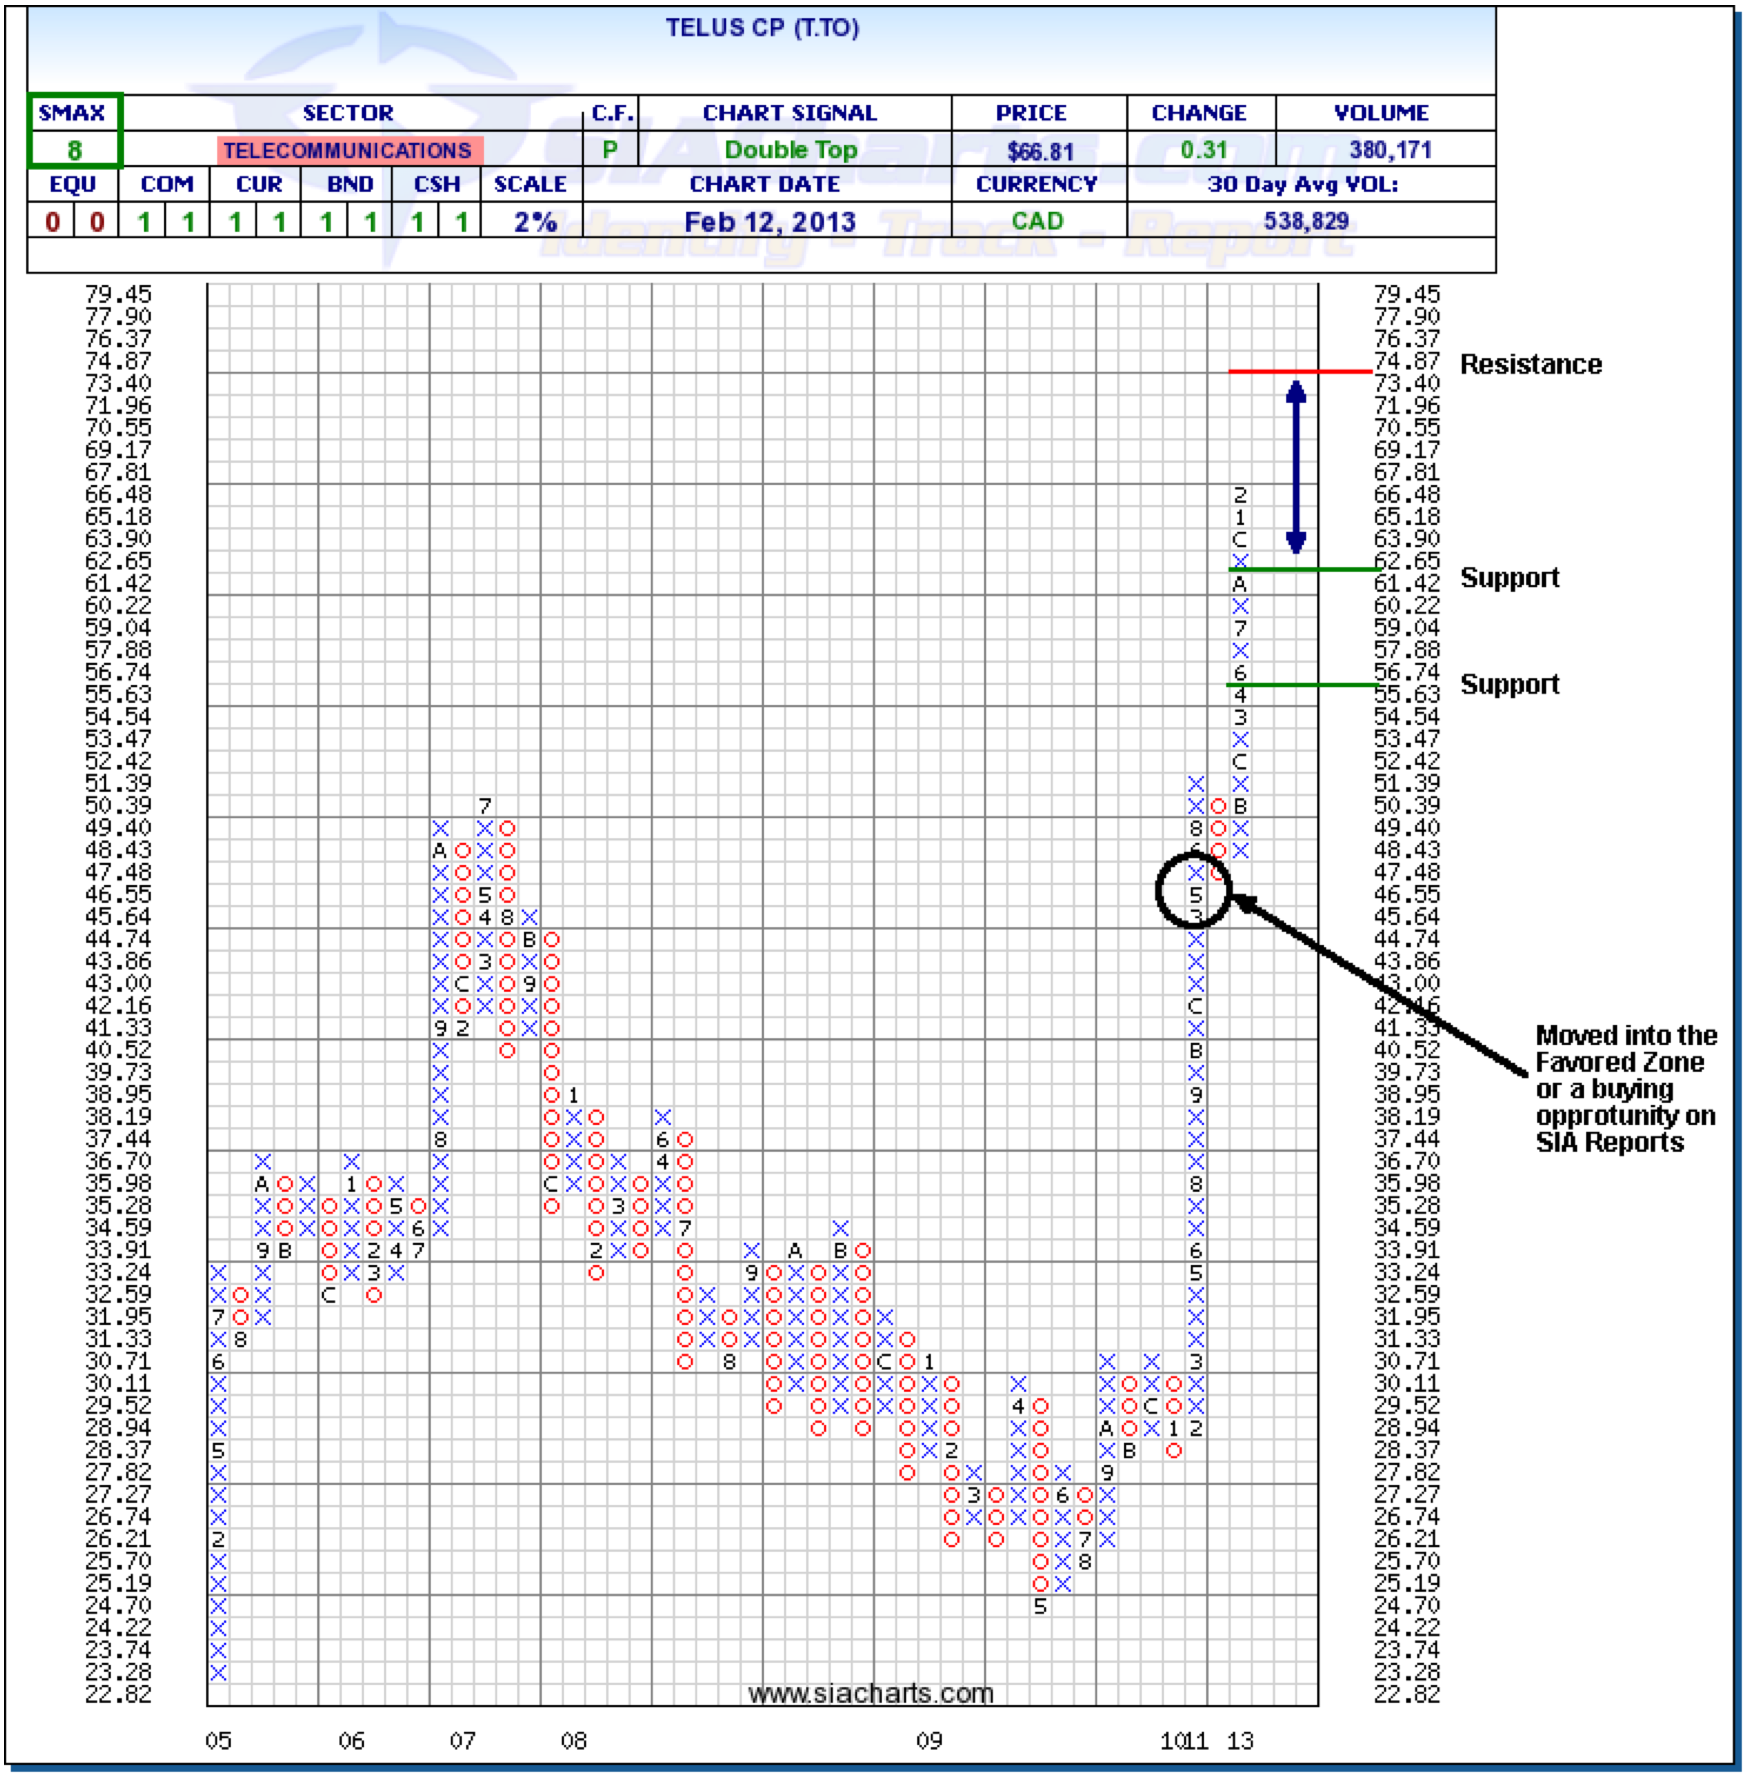
So can we still find good dividend paying Canadian equities? More and more advisors are looking for dividend paying stocks, but why not also find ones that have good growth potential as well. Telus Corporation (T.TO) has been one of those consistent performers over the past 21 months that continues today to move on to new all-time highs. It has a 3.65% yield so just by the dividend payout alone it is an attractive offer, but Telus has also returned almost 19% over the past year and a total of 33.6% since May 4, 2011 when Telus became Favored in the SIA S&P/TSX 60 Report.
In the dividend adjusted chart of Telus, we can see when the SIA system first had T.TO as a buying opportunity in the Favored zone of its reports and the positive technical outlook it continues to show. The next target resistance level is found in the $75 area at $74.81 giving T.TO plenty of potential room to move. To the downside, support can be found at $61.42 and below this at $55.63.
So while the S&P/TSX Composite has been flat since August 31, 2011, by identifying Telus with SIACharts, we can still find favorable Canadian dividend paying stocks that would have comparatively returned a total of 31.8% over the same time period.
Click on Image to Enlarge
Copyright © SIACharts.com


