


Nothing shows this more clearly than the amount of excess bank reserves, which is the direct byproduct of QE programs, which exploded higher last week by $46.4 billion.
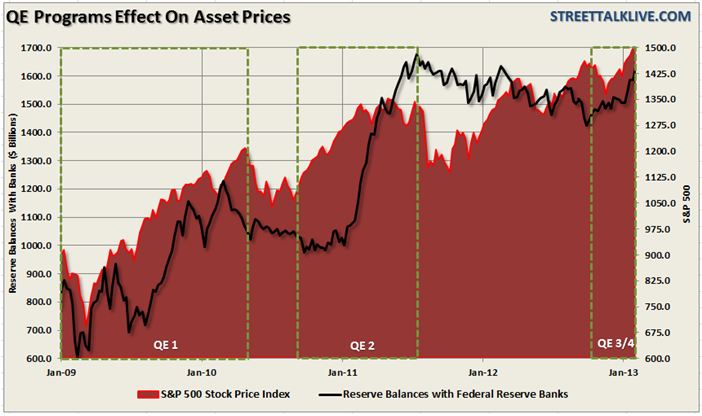
These liquidity pushes directly correlate with market ramp ups – not improving economics or fundamentals.
Of course, this is also why each time these programs come to an end the financial markets face steep corrections and economic growth plunges.
Into The Danger Zone
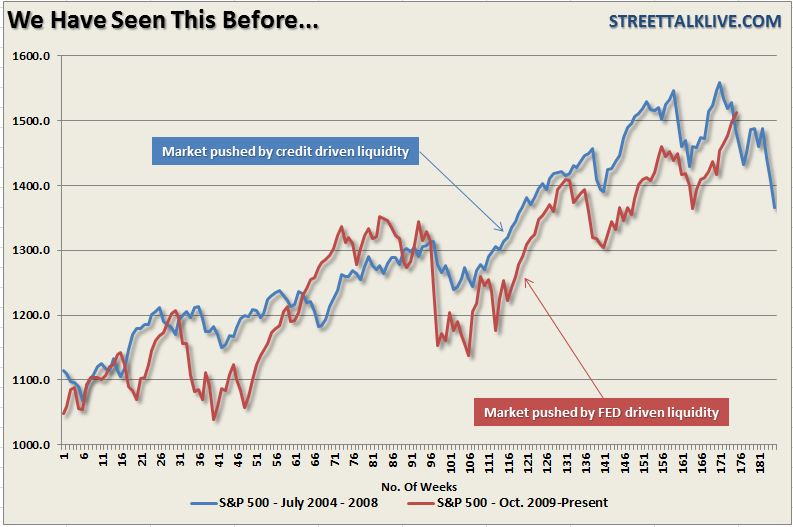
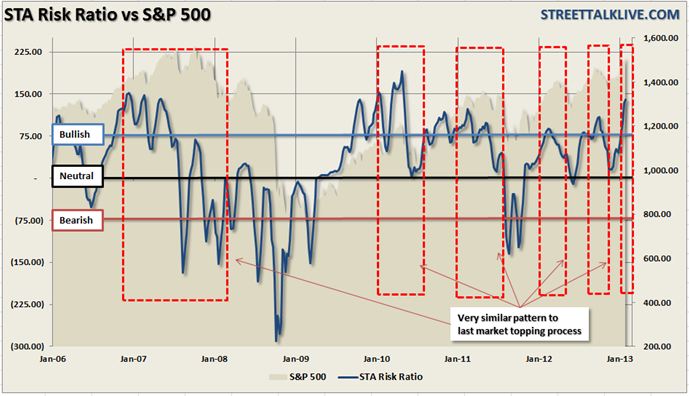
It is with this background that we continue to harp upon the dangers that are currently building in the markets. While no two market cycles are ever the same - they generally behave similarly over time. I have posted the following chart several times lately showing the high degree of correlation between the market bubble prior to 2007 and currently.
I expect that the chart will begin to decouple somewhat in the months ahead as there is not a relative crisis immediately available. However, come May when the debt ceiling issue resurfaces, or there is a resurgence of the Eurozone crisis, or some other exogenous event crops up – stock prices are likely to correct very sharply.
Using a weekly analysis, to slow down the day to day volatility of the market – the market currently cannot achieve a higher level of its overbought status. It is “pegged out”, “maxed,” or whatever other term you want to use to describe the extreme nature of the overbought condition that currently exists.
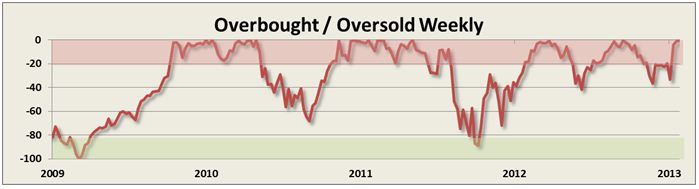
The chart on the next page overlays this overbought/oversold long term weekly indicator with a weekly chart of the S&P 500.
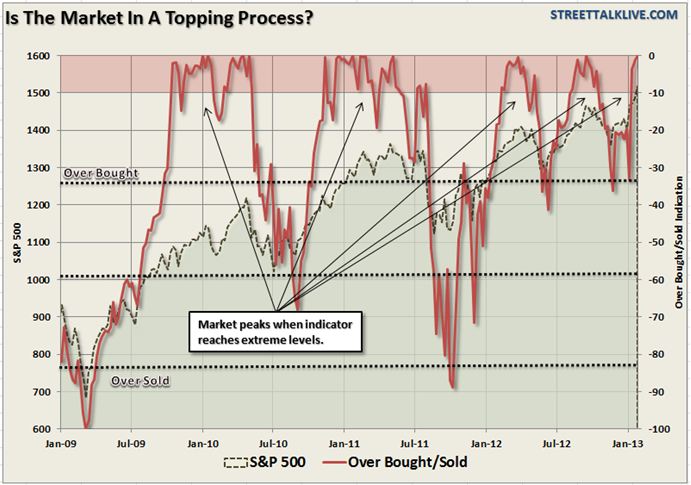
See the potential problem here?
The next chart shows the STA Risk Ratio indicator which is a composite index of the rate of change in the S&P 500, bullish versus bearish sentiment, the volatility index, and a ratio of new highs to new lows. Currently, that index is approaching levels normally only seen at very significant market tops.
I could show you chart after chart after chart. They all say the same thing – the market is extremely overbought and is currently pushing the limits of the current upside advance.
What I Am NOT Saying
The bulk of the mainstream media’s, and analyst’s, blathering is more akin to a parade of idiots rather than something you should actually spend your time paying attention to. Pay attention to the data.
While I have spilled an exorbitant amount of ink this week on all the reasons why the market is getting extremely overbought and into very dangerous territory – I am not saying that you should sell everything and hide in cash.
This may sound very counter-intuitive but the markets are being driven by the expansion of the Fed’s balance sheet. Therefore, due to this artificial influence, the market can move higher, for longer, than you can possibly fathom. It will end, eventually, and it will end badly.
However, in the meantime, this is how to approach the current market.
1) Do not add to equity exposure at this time no matter how emotionally conflicted you become. Emotions lead to bad investment decisions - always.
2) Sell some, not all, of positions that are speculative in nature and have a lot of volatility. When the correction comes these will be hit the hardest.
3) Increasing stock markets suppress bond prices. Therefore, rotate some money into bonds which will benefit from a stock market correction – “Buy where the money ain’t goin’.”
4) Hoard cash – you can’t be a buyer when things get “cheap” when you don’t have any cash to buy with.
5) Rotate from very aggressive equity exposure to more defensive positions that have an income stream. (ie utilities, staples, and healthcare) However, these positions WILL lose money when the market corrects – just not as much.
6) Beware of high-dividend plays particularly REITS and MLP’s. The majority of these positions are GROSSLY overbought and overvalued and a correction of magnitude will lead to larger losses than you can currently comprehend.
7) Fundamental valuations HAVE NO bearing on a stock market correction. No matter how fundamentally strong you think your investments are they will generally correct as much, or more, than the market. Fundamental value is only effective for eliminating bankruptcy risk. In a market environment driven primarily by programmed trading it is only PRICE ANALYSIS that matters.
8) Did I mention hoarding cash?
9) Pay attention to the trend. The trend is currently positive and we want to mindful of that. It will require a VERY substantial price correction at this point before a SELL signal is issued. This is why profit taking, and keeping new savings in cash, is the best way to stay invested but reduce overall portfolio risk.
10) Just because you take profits, or sell a position today, DOES NOT mean that you can’t buy it back after it corrects. That is just a good portfolio management practice. There IS NO successful investor – ever in history – that only “bought and held.”
There will be corrections which are buying opportunities and there will be corrections that aren't. Unfortunately, you will never know which is which until it is too late. This is why employing rudimentary rebalancing processes, or even basic risk management tools, to your investment portfolio will work to protect your investment principal overtime. Are you going to get out at the tops and in at the bottoms? No. Are you going to be the next great market timer? No. Will you keep from setting yourself back years from reaching your retirement goals? Definitely.
Copyright © Street Talk Live


