In this week's edition of the SIA Equity Leaders Weekly we are going to take a look at the U.S. fixed income market. The long end of the bond market has been very strong for the past few years on weaker rates and uncertainty in equity markets causing investors to buy bonds over alternative asset classes. This trend is in jeopardy though, as we continue to see the Equity Markets in the U.S. strengthen and in the last week many of the major indices hit 5 year highs.
CBOE Interest Rate 30 Year Yield (TYX.I)
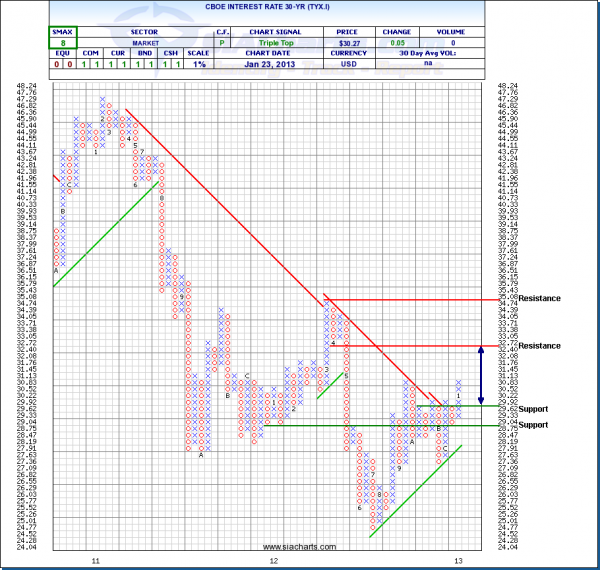
The first chart we are going to look at is the 30 Year Yield. We have not written about this chart since November but as we will see, it has seen a material change.
The chart has breached its downtrend line that has been in place since the latter part of 2011. Since 2011 bonds on the long end of the curve have seen dramatic capital appreciation so a move up in the yield suggests more risk at the long end of the curve. The chart also shows us that the next material test for for the yield is in the 3.272% with room to 3.50% from there. Support is above 2.962%.
iShares Trust Barclay's 20+ Year Treasury (TLT)
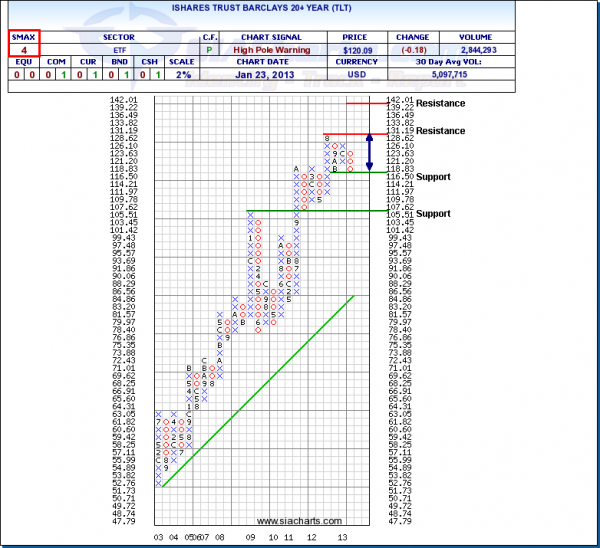
Our second chart shows us the strong run that bonds on the long end of the yield curve have seen in the last decade and more recently with a 33% move since late 2011.
The chart shows us that we have seen a pull back in the long bonds as TLT reached its first support level above $116.50 after reaching its highs in August 2012 below $131.19.
This move has not breached any major support levels but in conjunction with the 30 year yield breaching its downtrend line and the relative strength in equities those on the long end of the bond curve should pay extra attention to their positions in the near term.
Copyright © SIACharts.com


