In our final Equity Leaders Weekly of 2012 we are going to take a final look at the U.S. and Canadian Equity and Bond Benchmark Comparison Charts. These comparison charts have moved back and forth since late 2011 as the battle between equities and bonds struggle for dominance. Today's analysis will show us not only the historical relationship between equities and bonds in the two countries, but also where they end a less than directional year.
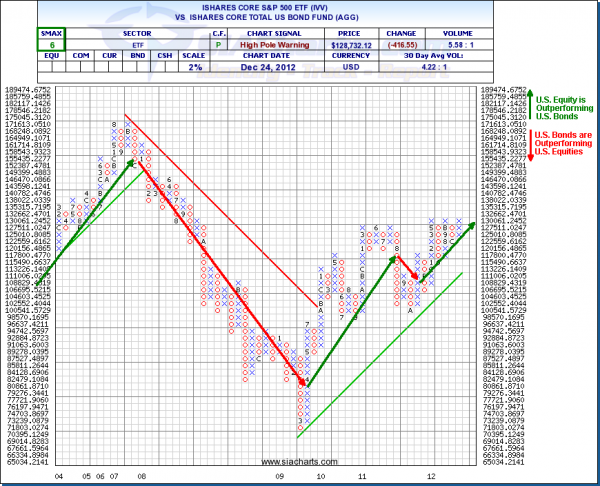
iShares Core S&P 500 ETF vs. iShares Core Total U.S. Bond ETF (IVV^AGG)
The first chart we are going to look at is the comparison between U.S. Equities and Bonds. As our readers are aware U.S. Equities have been the dominate equity market benchmark for 15 months. This relative equity strength has also seen it as the best relative performer vs. its countries fixed income benchmark. The chart to the right shows us that since late 2011 U.S. Equities have outperformed U.S. Bonds. This relative outperformance has had 3 reversals over the past 15 months, but for now, continues to trend upwards in Favor of Equities. The chart also shows us that a level of resistance is being tested with a close above suggesting continued strength for U.S. Equities.
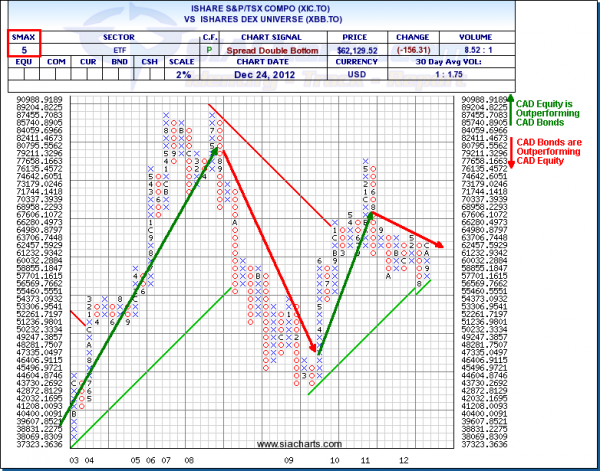
iShares S&P/TSX Composite ETF vs. iShares DEX Bond Universe ETF (XIC.TO^XBB.TO)
The second chart we are going to look at is the comparison between CAD Equities and Bonds. This comparison has not fared as well as the same comparison in the U.S. The chart to the right shows us the trend for CAD Equities vs. CAD Bonds has been on the decline since the latter part of 2011. The current situation sees a column of X's suggesting near term strength for CAD Equities but such reversals over the past 16 months have failed with Bonds gaining more strength on the subsequent move.
From the charts we have viewed in today's ELW we can see that 2012 is closing in the same way that it opened, slight outperformance in U.S. Equities and slight underperformance in CAD Equities. Although these trends are modest we must still use them in our asset allocation as they provide us with focus points when we look for equity ideas, which remain primarily in the U.S. space.
Copyright © SIACharts.com


