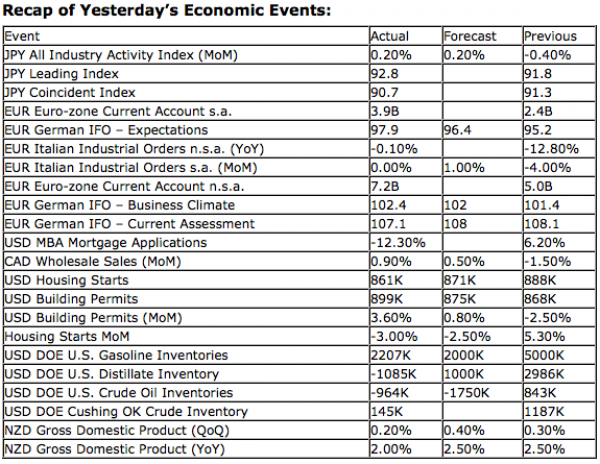
Upcoming US Events for Today:
- Final GDP for the Third Quarter will be released at 8:30am. The market expects an increase of 2.8% versus an increase of 2.7% previous.
- Weekly Jobless Claims will be released at 8:30am. The market expects Initial Claims to show 359K versus 343K previous.
- Existing Home Sales will be released at 10:00am. The market expects 4.9M versus 4.79M previous.
- The Philadelphia Fed Index for December will be released at 10:00am. The market expects –2.0 versus –10.7 previous.
- The FHFA Hosing Price Index for October will be released at 10:00am. The market expects an increase of 0.3% versus an increase of 0.2% previous.
- Leading Indicators for November will be released at 10:00am. The market expects a decline of 0.2% versus an increase of 0.2% previous.
Upcoming International Events for Today:
- German PPI for November will be released at 2:00am EST. The market expects a year-over-year increase of 1.3% versus an increase of 1.5% previous.
- Great Britain Retail Sales for November will be released at 4:30am EST. The market expects a year-over-year increase of 1.4% versus an increase of 0.6% previous.
- Canadian Retail Sales for October will be released at 8:30am EST. The market expects a month-over-month increase of 0.2% versus an increase of 0.1% previous.
The Markets
Markets sold off on Wednesday after a strong two-day rally to start the week. Renewed fiscal cliff concerns influenced the profit taking session as Boehner threatened to hold the president responsible if he does not pass his “Plan B” bill, which would extend Bush era tax cuts for all individuals making less than one million dollars. The president had campaigned and won on the prospect to increasing taxes on individuals making $250,000 or more, something that he has recently bent on in order to compromise with Republicans. The deadlock continues.
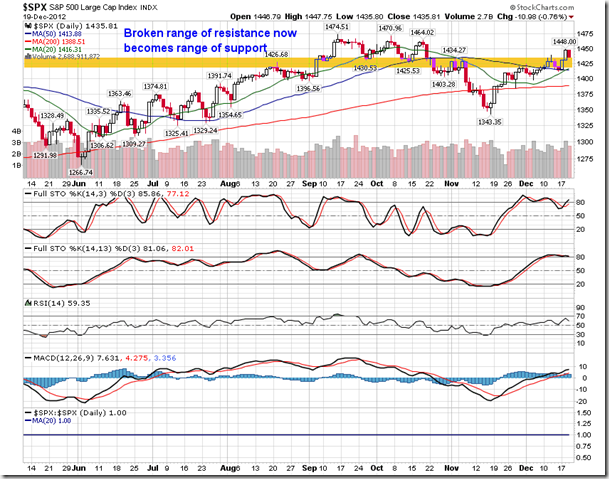
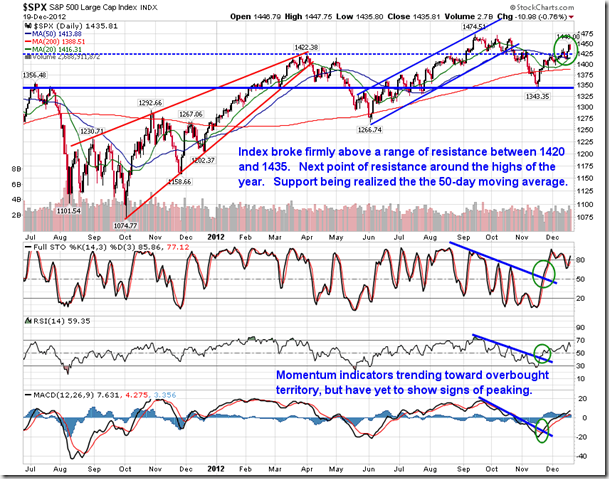
Looking at the S&P 500 Index, the benchmark pulled pack to a very logical place. On Tuesday the equity index broke out of a range of resistance that stretched up to 1435, representing the November highs. The benchmark pulled back to the top of this range as of Wednesday’s close, testing the significant breakout which has the potential to propel the market back to the highs of the year. Price action continues to hold above 20 and 50-day moving averages, defining strength over a short and intermediate-term scale. A bullish crossover of the 20 and 50-day moving average has now been realized. Momentum indicators remain overbought, but have yet to show signs of turning lower.
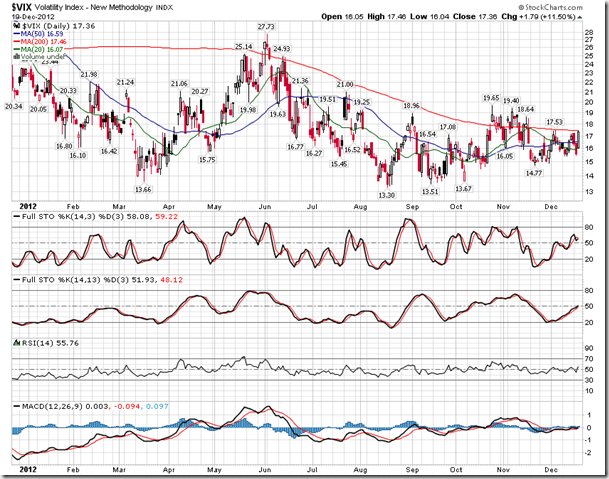
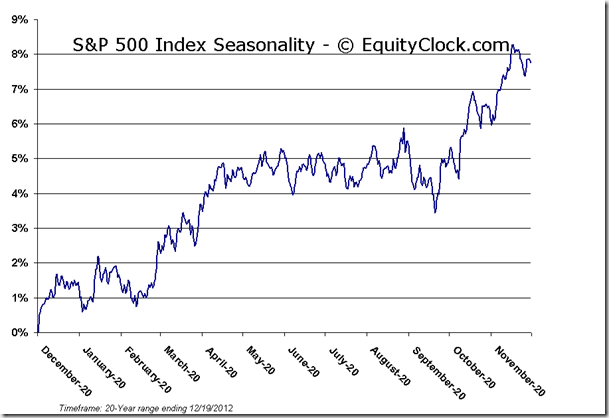
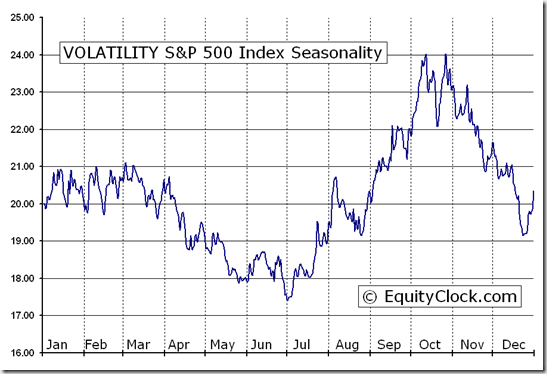
All indications suggest that the Santa Claus rally is underway and the effect of which would have much more impact into next week as we get past options and futures expiration day this Friday. This event has certainly exacerbated volatility in the commodity market and has the potential to keep volatility high in the equity market as well until the event concludes. The VIX surged on Wednesday, partly as a result of this expiration event. The volatility index is now testing its 200-day moving average, a level that it has had trouble sustaining any strength above throughout the course of the year. The VIX is seasonally negative coming into December, but does typically inch higher into the end of the year as investors add protective put options to portfolios during the holiday period.
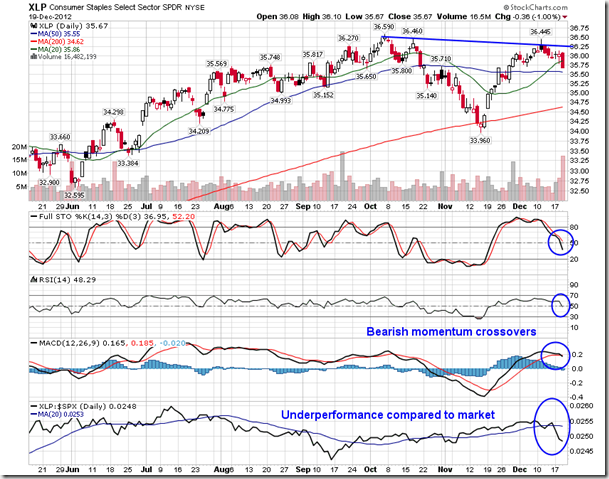
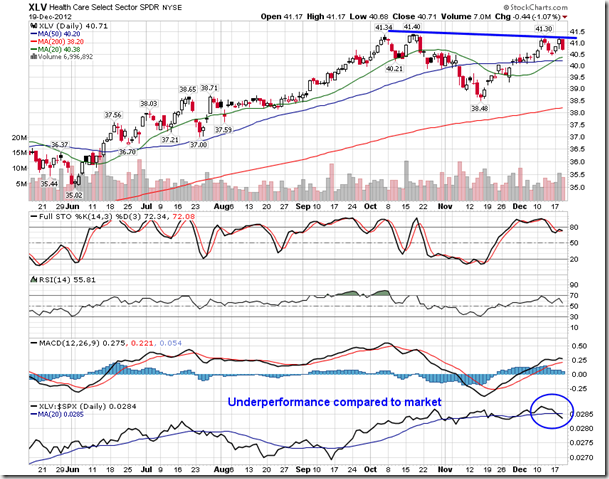
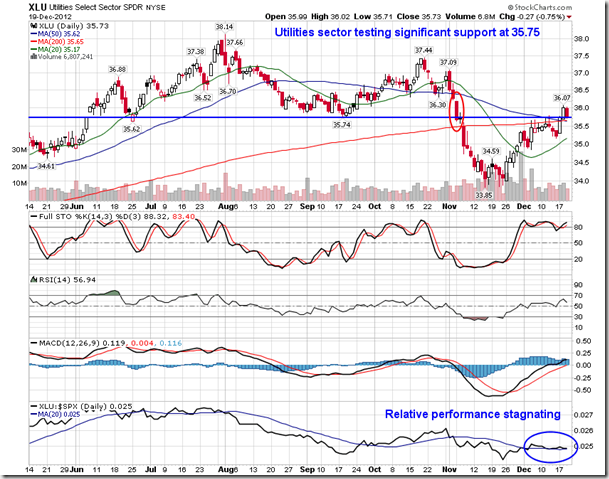
Despite the equity market declines on Wednesday, risk-on remained very much apparent. Defensive sectors were the worst performers on the day, underperforming the market, while cyclicals topped the market performance. Consumer Staples and Health Care both showed losses exceeding 1%, while Materials and Technology were the best performers, posting losses of around half a percent. As long as investors continue to demand cyclicals over defensives, a bullish bias is warranted as a risk-on sentiment is implied.
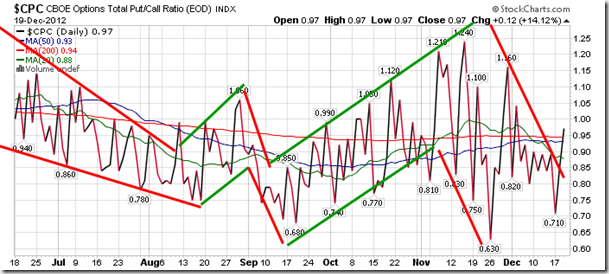
Sentiment on Wednesday, as gauged by the put-call ratio, ended around neutral at 0.97. As option expiration date nears, investors are settling open positions, typically leading to significant spikes in the put-call ratio, as we saw yesterday.
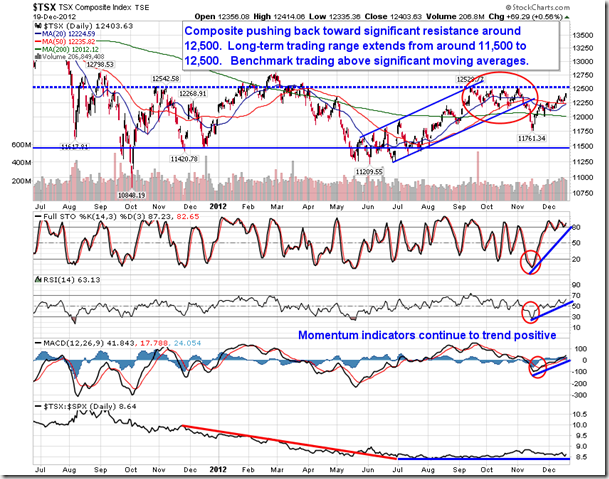
Chart Courtesy of StockCharts.com
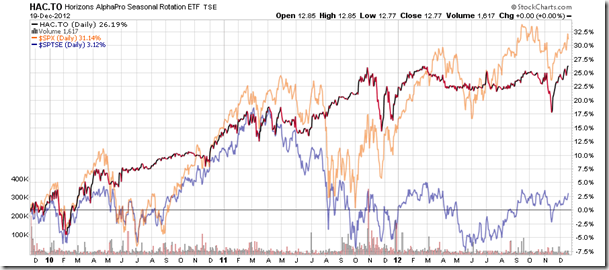
Chart Courtesy of StockCharts.com
Horizons Seasonal Rotation ETF (TSX:HAC)
- Closing Market Value: $12.77 (unchanged)
- Closing NAV/Unit: $12.77 (down 0.31%)
Performance*
| 2012 Year-to-Date | Since Inception (Nov 19, 2009) | |
| HAC.TO | 4.84% | 27.7% |
* performance calculated on Closing NAV/Unit as provided by custodian
Click Here to learn more about the proprietary, seasonal rotation investment strategy developed by research analysts Don Vialoux, Brooke Thackray, and Jon Vialoux.


