by Don Vialoux, et al, TechTalk
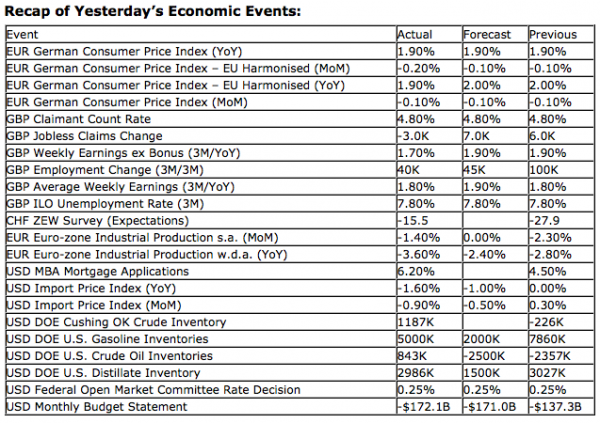
Upcoming US Events for Today:
- Weekly Jobless Claims will be released at 8:30am. The market expects Initial Claims to show 370K, consistent with the previous report.
- Producer Price Index for November will be released at 8:30am. The market expects a month-over-month decline of 0.5% versus a decline of 0.2% previous. Less food and energy, a gain of 0.2% is expected versus a decline of 0.2% previous.
- Retail Sales for November will be released at 8:30am. The market expects a month-over-month increase of 0.6% versus a decline of 0.3% previous. Less autos and gas, the market expects an increase of 0.5% versus a decline of 0.3% previous.
- Business Inventories for October will be released at 10:00am. The market expects a month-over-month increase of 0.4% versus an increase of 0.7% previous.
Upcoming International Events for Today:
- The Swiss National Bank Rate Decision will be released at 3:30am EST. The market expects no change at 0.00%.
- The ECB Publishes its monthly report for December at 4:00am EST.
- Japan Tankan Large Manufacturers Outlook for the fourth quarter will be released at 6:50pm EST. The market expects –10 versus –3 previous.
- China HSBC Flash Manufacturing PMI for December will be released at 9:45pm EST. The market expects 50.8 versus 50.5 previous.
The Markets
Markets ended near the flatline on Wednesday, giving up earlier gains following the Fed Chairman’s press conference. The Fed will continue to provide monetary stimulus for as long as it takes to get unemployment rate down to 6.5%. The rate currently stands at 7.7% after showing an unexpected decline in the most recent report. The widely anticipated move boosted stocks earlier in the session, but selling pressures resumed in late day trading as investors questioned the efficacy of monetary policies given the extreme fiscal uncertainties.
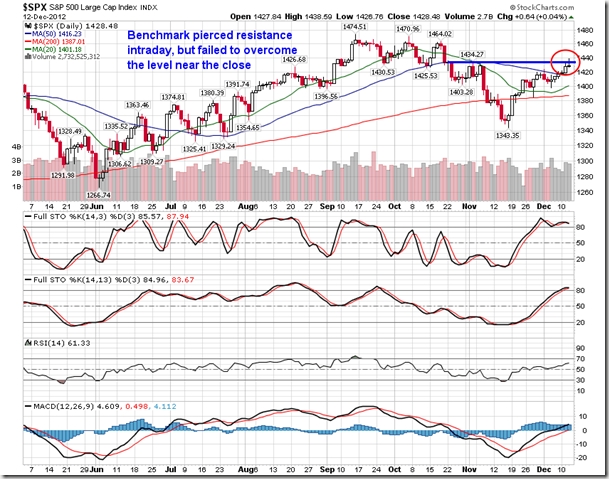
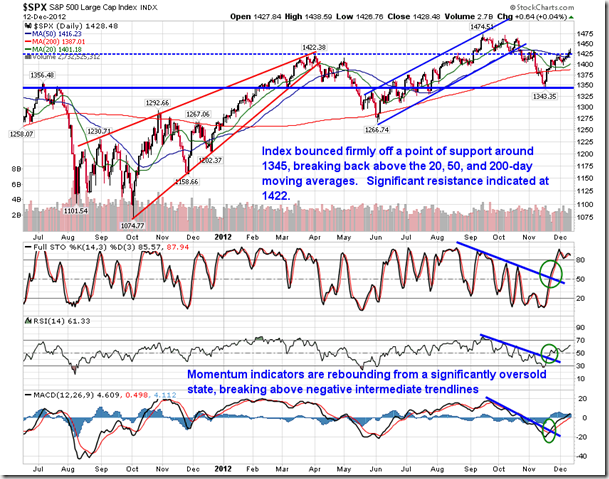
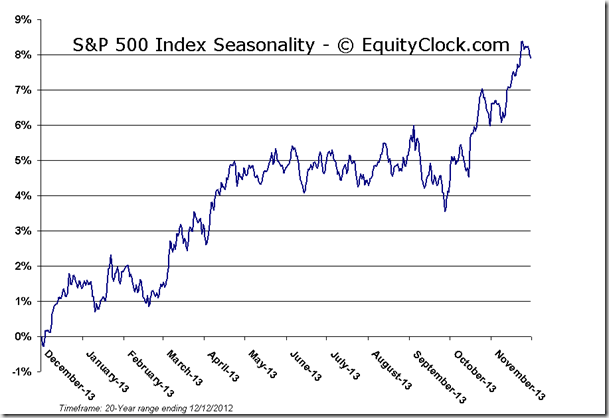
Wednesday’s market activity saw the S&P 500 pierce through resistance at 1435, trading almost as high as 1439 at the session peak, but the close of 1428 continues to leave the benchmark below the significant level of resistance that is restraining a more significant upside move into year end. Fiscal cliff uncertainties continue to hold back investors from placing more significant bullish bets. Starting next week equity markets enter into the Santa Claus rally period, which typically lifts markets higher into year end. Upside potential for the market between now and then continues to be significant, assuming fiscal cliff negotiations don’t derail the present bullish equity market bias.
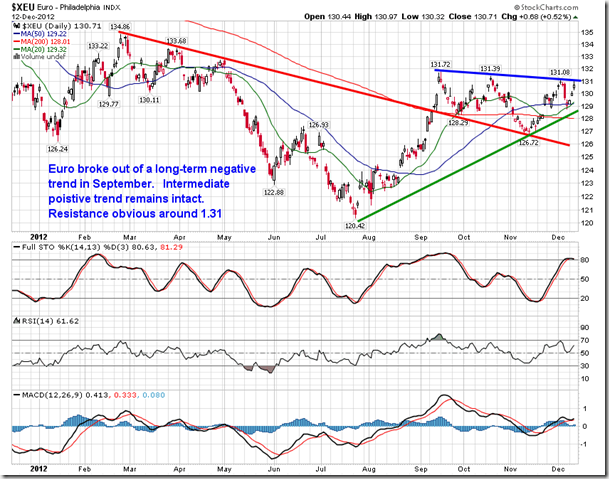
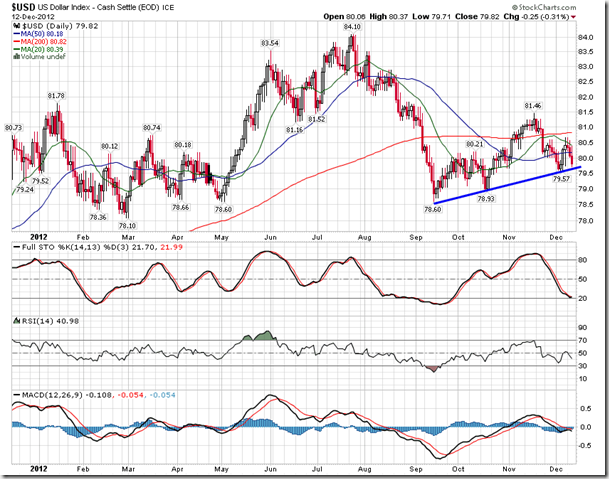
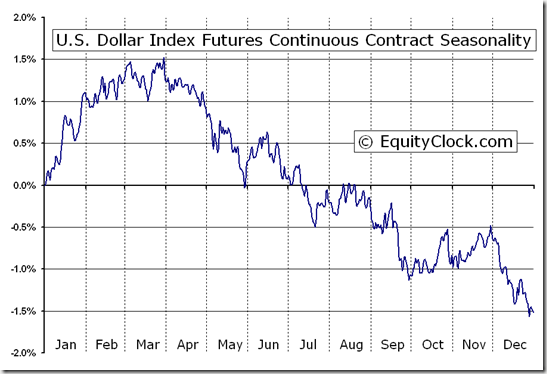
Wednesday’s Fed action caused the US Dollar Index to dip and the Euro to gain. The Euro is now back to an intermediate level of resistance and the US Dollar index is at an intermediate level of support. A breakout in the Euro coinciding with a breakdown in the US Dollar from current levels would be supportive of risk in the markets; stocks and commodities are the likely beneficiaries. The US Dollar index remains negative throughout December, then turning positive in January, so any breakdown in the domestic currency could be short-term.
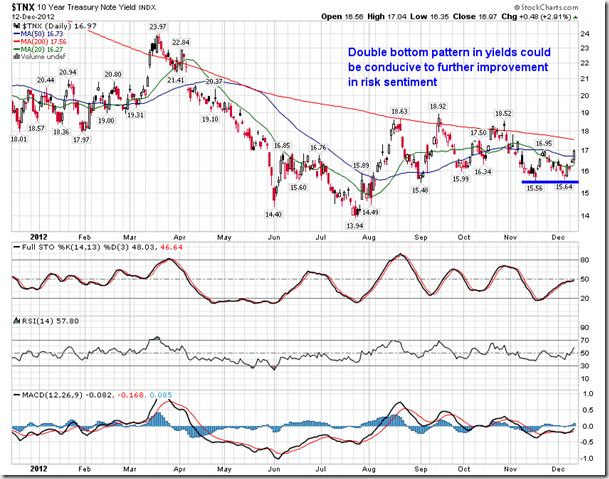
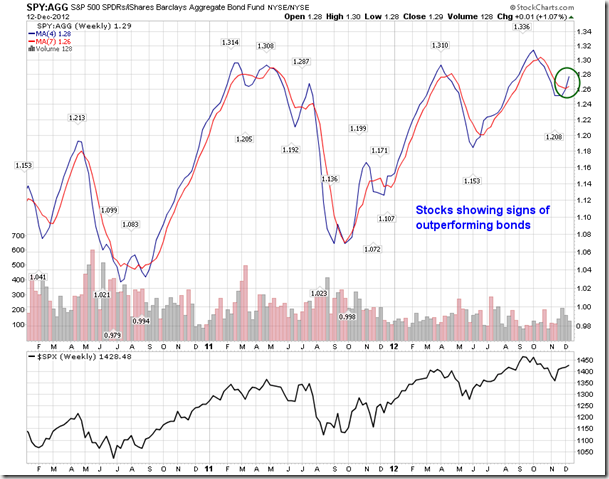
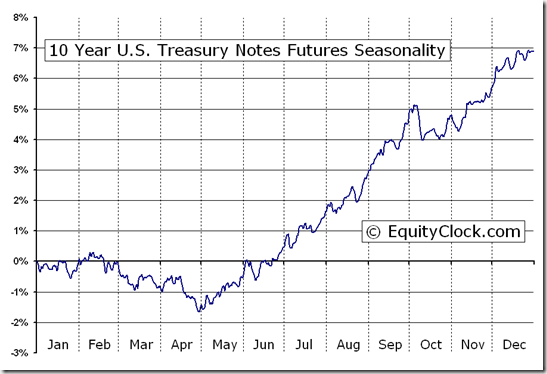
And despite the Fed’s pledge to keep rates low for a prolonged period of time, yields gained on following the FOMC announcement. The yield on the 10-year treasury note is confirming a short-term double bottom around 1.56% after charting a series of lower-highs and lower lows since the middle of September, the previous equity market peak. Weakness in bond prices, coinciding with increasing yields, could force a transition from the overcrowded bond trade into stocks, boosting equity prices. Bonds are nearing a period of seasonal weakness from January through April, the result of which leads to gains in equities as investors rotate out of the fixed income asset class during the start of the year. Equities have been showing signs of outperformance against bonds (as gauged by the ratio of the S&P 500 ETF – SPY versus the Aggregate Bond Fund – AGG) since the middle of November. A short-term bullish moving average crossover was realized within the past few sessions, typically conducive for further gains in equity markets.
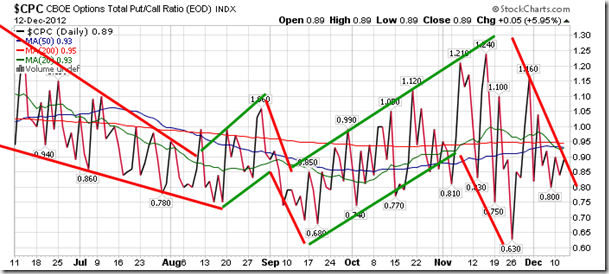
Sentiment of Wednesday, as gauged by the put-call ratio, ended bullish at 0.89.
S&P 500 Index
Chart Courtesy of StockCharts.com
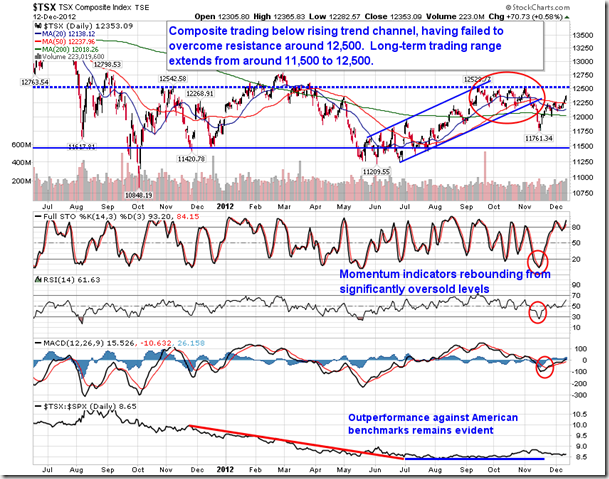
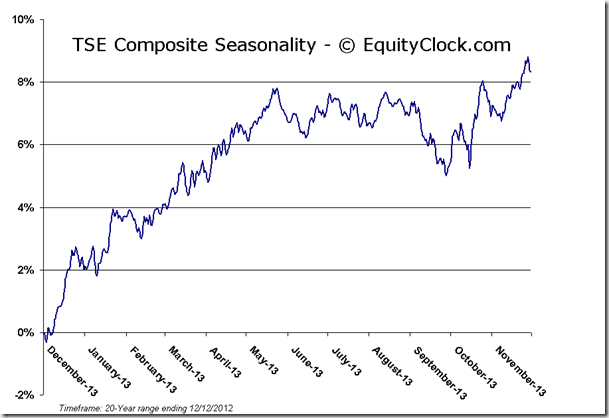
TSE Composite
Chart Courtesy of StockCharts.com
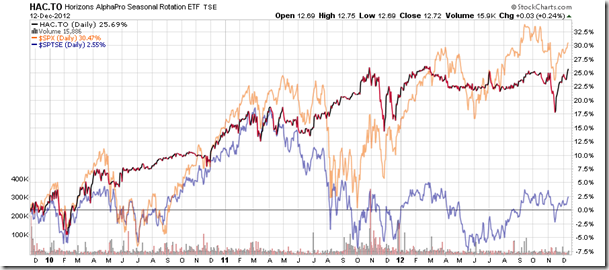
Horizons Seasonal Rotation ETF (TSX:HAC)
- Closing Market Value: $12.72 (up 0.24%)
- Closing NAV/Unit: $12.71 (up 0.16%)
Performance*
| 2012 Year-to-Date | Since Inception (Nov 19, 2009) | |
| HAC.TO | 4.35% | 27.1% |
* performance calculated on Closing NAV/Unit as provided by custodian
Click Here to learn more about the proprietary, seasonal rotation investment strategy developed by research analysts Don Vialoux, Brooke Thackray, and Jon Vialoux.
Copyright © TechTalk


