SIA Equity Leaders Weekly Report
December 12, 2012
For this weeks edition of the SIA Equity Leaders Weekly we are going to focus in on the U.S. Equity Asset Class and take a look at a couple of the sector ETF's that are currently performing well in the SIA U.S. Equity Specialty ETF Report. With U.S. Equity continuing to be the top ranked asset class in the SIA Asset Allocation model, looking at some of the highest ranked sectors may help us to determine where we want to be placing our dollars and if the markets are matching what we see in the broader media.
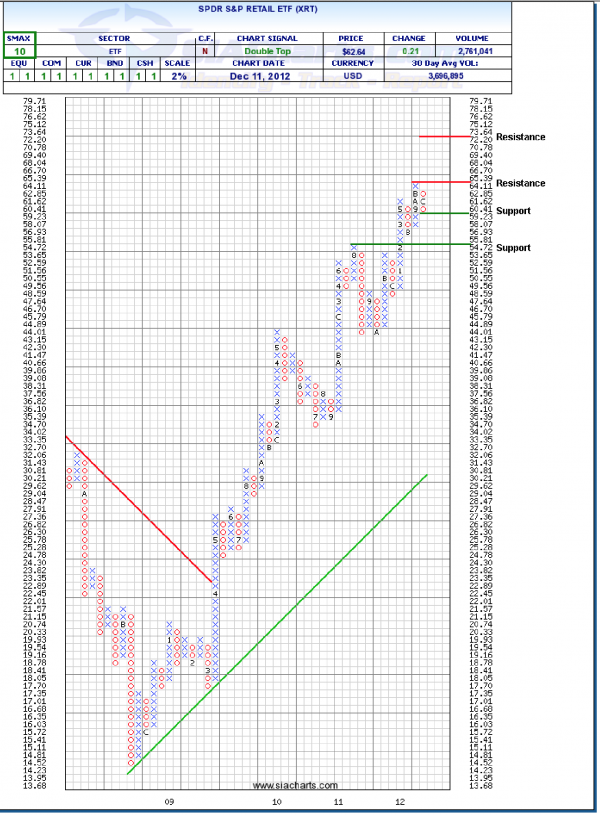
SPDR S&P Retail ETF (XRT)
Looking at the chart to the right we can see that after a new run up to multi-year highs, the S&P Retail ETF has now pulled back to its first support level at $59.23. Should we see continued weakness, the next support level at $54.72 may come into play.
To the upside, resistance is found overhead at $65.39. If it breaks through this prior high, XRT has some room to move towards the next potential target resistance level is at $73.64.
With the SMAX currently at 10, the XRT is showing showing near-term strength against all the asset classes.
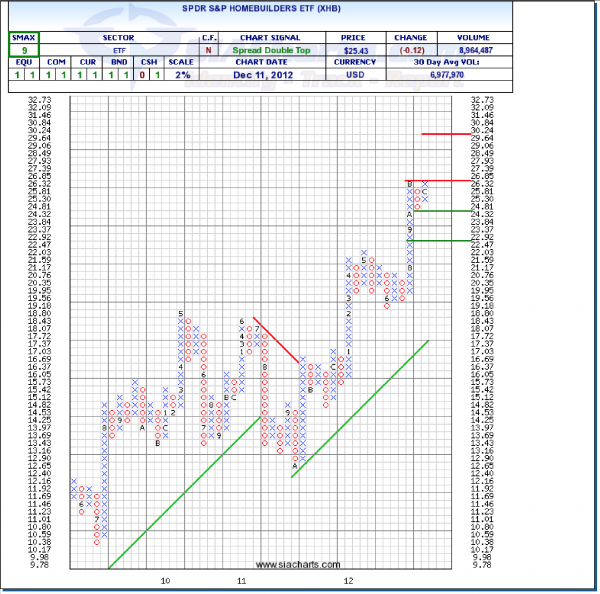
SPDR S&P Homebuilders ETF (XHB)
The last several months have been quite positive for the SPDR S&P Homebuilders ETF with only a slight pullback to its first support level at $24.32 being the only real downside move. The XHB has already recovered from that pullback and is now pressed up against the resistance level and prior high at $26.85. Should this level break then the next potential target resistance is at $30.24.
To the downside secondary support is at $22.47. With the SMAX at 9, this ETF is showing near-term strength against the other asset classes.
With the uncertainty surrounding debt, politics, consumer spending, and joblessness seeing Retail and Home Building at the top of the sector report gives an interesting perspective on how reality can differ from the subjective media.

Important Disclaimer
SIACharts.com specifically represents that it does not give investment advice or advocate the purchase or sale of any security or investment. None of the information contained in this website or document constitutes an offer to sell or the solicitation of an offer to buy any security or other investment or an offer to provide investment services of any kind. Neither SIACharts.com (FundCharts Inc.) nor its third party content providers shall be liable for any errors, inaccuracies or delays in content, or for any actions taken in reliance thereon.
Copyright © siacharts.com


