Upcoming US Events for Today:
- The FOMC Meeting begins
- International Trade for October will be released at 8:30am. The market expects -$42.8B versus -$41.5B previous.
- Wholesale Trade for October will be released at 10:00am. The market expects an increase of 0.4% versus an increase of 1.1% previous.
Upcoming International Events for Today:
- German Economic Sentiment Survey for December will be released at 5:00am EST. The market expects Business Conditions to show 6.0 versus 5.4 previous. Business Expectations are expected to show –12.0 versus –15.7 previous.
- Canadian Merchandise Trade for October will be released at 8:30am EST. The market expects -$1.20B versus -$0.83B previous.
The Markets
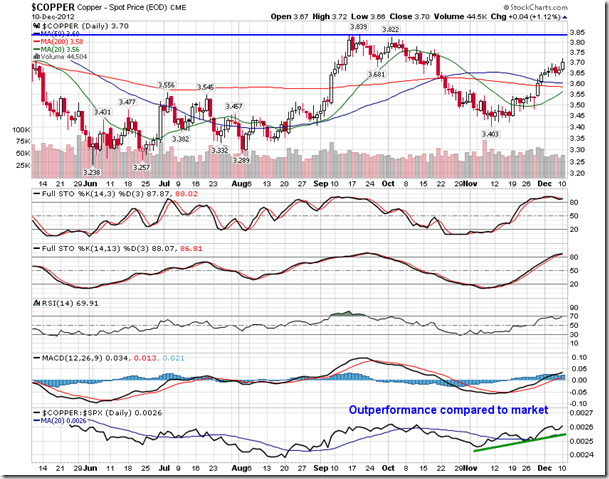
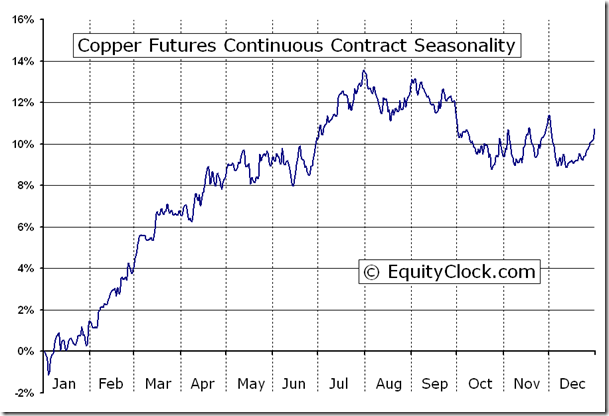
Markets pushed higher on Monday ahead of the two day Fed meeting that is expected to see an extension to current stimulus programs. According to CNNMoney.com “economists are expecting that the Fed will convert its program from swapping short-term bonds from long-term bonds into an outright bond purchase program.” Gold, Silver, and Copper were all significant beneficiaries from the Fed speculation, which put pressure on the US dollar. Copper has been showing signs of outperformance compared to the market since the beginning of November, gaining based on strong housing data and improving Chinese economic indications. Seasonal tendencies for the commodity turn positive around this time of year, primarily due to this very reason. Gains between now and the end of April typically reach 11%, on average. Resistance for the metal is indicated around 3.84, the mid-September highs.
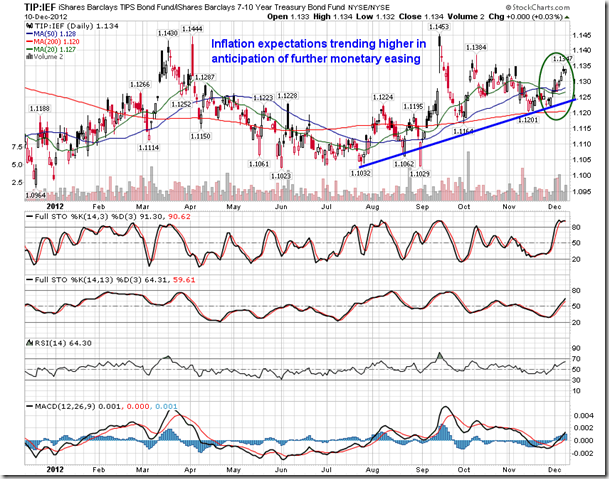
As a result of the continued expectation of monetary easing, inflation expectations have been trending higher since late summer. Using the ratio of the Treasury Inflation Protected ETF (TIP) versus the 7 – 10 Year Treasury Bond Fund (IEF) in order to gauge inflation expectations, a low was hit in July, just prior to the announcement of what has been dubbed “QE Infinity.” The trend has remained higher ever since with the ratio now attacking the start of November peak. An inflationary environment is bullish for risk assets, such as stocks and commodities.
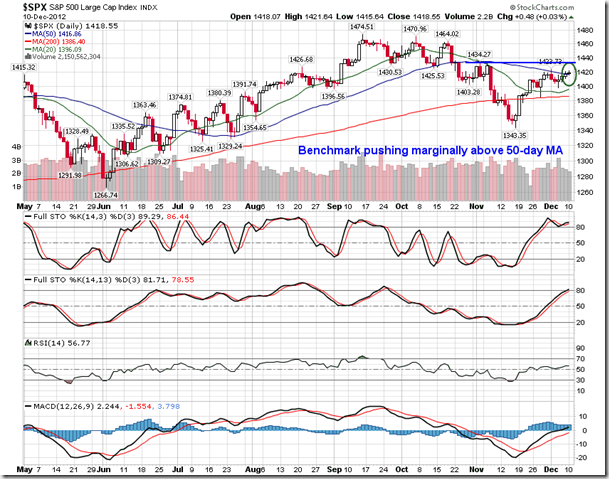
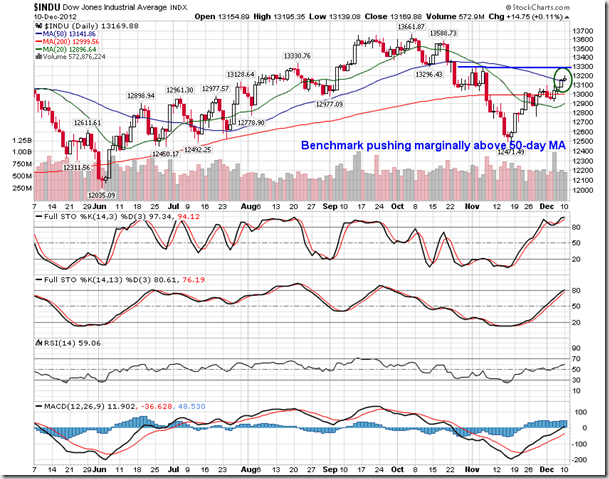
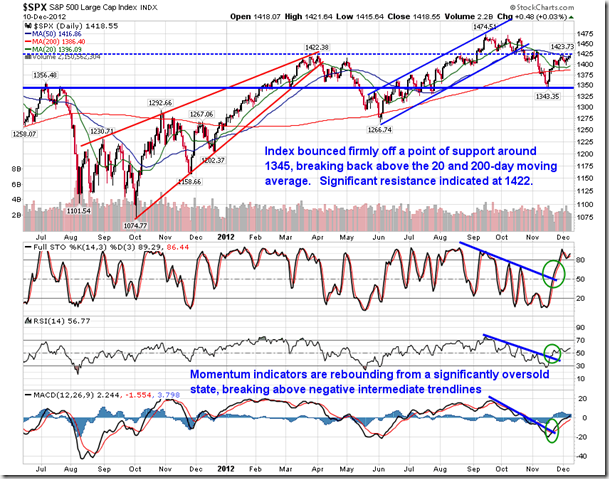
With the gains on Monday, the S&P 500 and the Dow Jones Industrial Average pushed marginally above 50-day moving averages, a key battleground resisting stocks as investors maintain a cautious stance in the midst of fiscal cliff negotiations. What is critical now is continued improvement above this level and for the benchmarks to hold above this level for a number of days to attempt to turn the direction of this intermediate moving average, which has been showing signs of curling lower. Albeit overbought, momentum indicators remain bullish. A move above November’s highs of around 1434 for the S&P 500 index would break the recent intermediate trend of lower-lows and lower-highs, reiterating a long-term positive trend of higher-highs and higher-lows. Fiscal cliff negotiations remain a key variable that could crush or confirm the recent equity market strength.
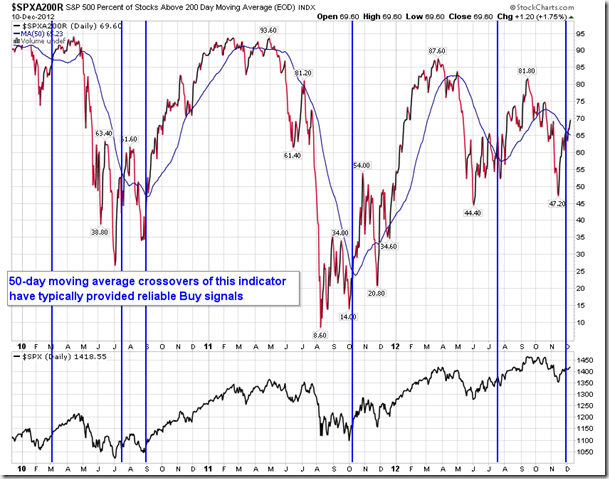
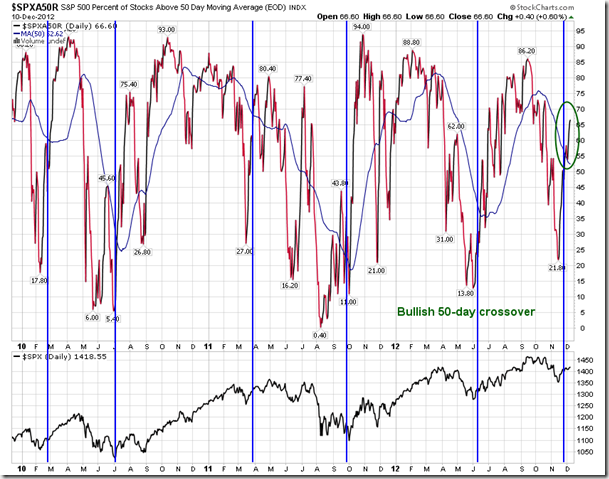
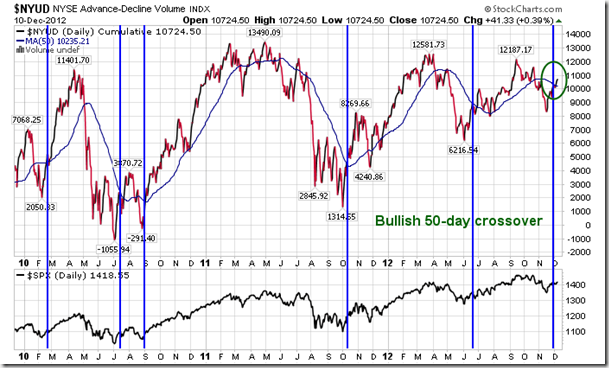
A number of technical indicators are increasingly becoming bullish, providing buy signals within the last few days. Those of you that have been following this site for a while probably know of my affinity toward using the percent of stocks within the S&P 500 trading above 200-day moving averages as a signal to buy or sell the broad market. As the indicator crosses above its own 50-day moving average line, gains have typically follow. Conversely, a negative cross has typically provided reliable sell signals. A bullish crossover was recorded over the past few days, suggesting that further gains are to follow. Other similar indicators, such as the percent of stocks trading above 50-day moving averages and the NYSE Advance-Decline Volume line, are showing the same 50-day moving average bullish crossover. These bullish indications are encouraging for further gains in equity markets to come.
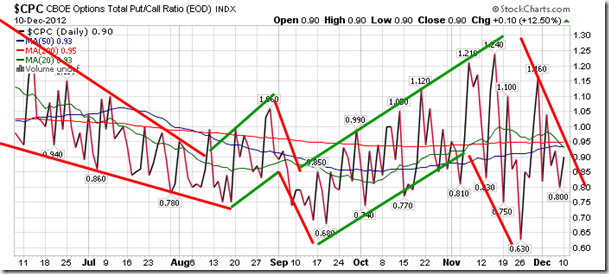
Sentiment on Monday, as gauged by the put-call ratio, ended bullish at 0.90.
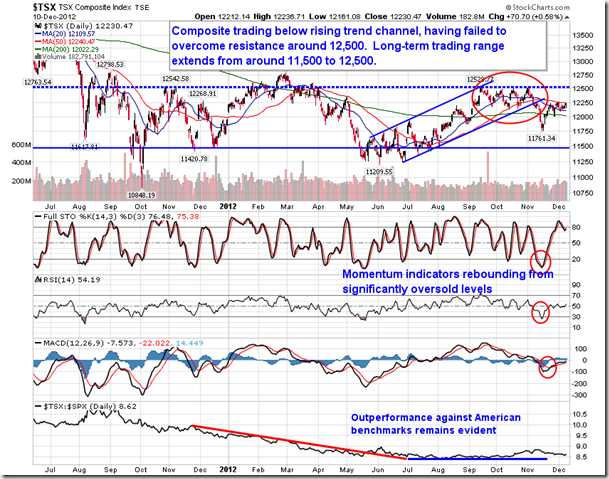
Chart Courtesy of StockCharts.com
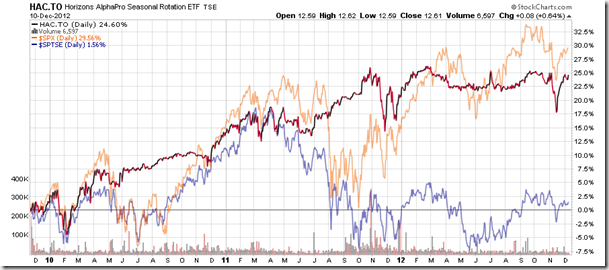
Chart Courtesy of StockCharts.com
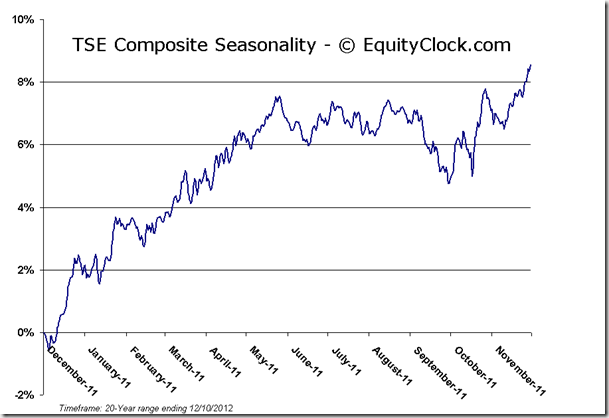
Horizons Seasonal Rotation ETF (TSX:HAC)
- Closing Market Value: $12.61 (up 0.64%)
- Closing NAV/Unit: $12.60 (up 0.40%)
Performance*
| 2012 Year-to-Date | Since Inception (Nov 19, 2009) | |
| HAC.TO | 3.46% | 26.0% |
* performance calculated on Closing NAV/Unit as provided by custodian
Click Here to learn more about the proprietary, seasonal rotation investment strategy developed by research analysts Don Vialoux, Brooke Thackray, and Jon Vialoux.


