December 4, 2012
by Liz Ann Sonders, Senior Vice President, Chief Investment Strategist, Charles Schwab & Co., Inc.
Key points
- Politics and the fiscal cliff are dominating market action and adding to the uncertainty factor.
- Sentiment is better, technicals are mixed and valuation is reasonable, but until we get past the cliff, fundamentals won't matter a lot.
- There are some coiled springs forming that could help offset any fiscal-cliff related contraction next year.
In a scene being played more and more these past few years, politics is dominating the market landscape. It brings an additional note of uncertainty into the picture, particularly since neither political party is trusted, according to recent polls, which show a record-low approval rating of Congress overall. One would think/hope that our elected leaders would understand the serious predicament our economy is in…one would think.
K Street controlling Wall Street
The stock market's correction this past spring was largely about economic fundamentals. But the stock market's correction from mid-September to mid-November was mostly about politics and the "fiscal cliff" and less about traditional fundamentals. The former manifested itself in sentiment indicators, which are often drivers of market movements in the short term.
As we begin the final month of the year, it's worth noting that December has been the strongest month of the year for the Dow Jones Industrial Average since 1900—up 72% of the time—with January also showing above-average strength. Decembers have been even stronger when the market's performance has been healthy through November. That said, none of those prior years had a fiscal cliff associated with it.
We haven't attempted to predict the political outcome of the cliff and can only try to be objective analysts with the data at our disposal. Today's report will review the sentiment, technical and valuation conditions of the market in light of the recent pullback and subsequent partial recovery.
Wall Street worries; Main Street doesn't
Given the market's rally off its mid-November low, many are wondering whether it's whistling past the fiscal-cliff graveyard. Odds of falling off the cliff have seemingly gone higher with "stalemate" and "nowhere" being the latest words used to describe the negotiations. We certainly wonder whether the market will have to riot to force an agreement in Washington. You may recall that this was necessary to ultimately get the Troubled Asset Relief Program passed during its second go-around in the fall of 2008.
In the meantime, the fiscal cliff appears to be less of a Main Street worry and more of a Wall Street worry. I'm not convinced this will turn out to be a Y2K-like non-event, but can't help but wonder whether the frantic reporting by the financial media will ultimately be seen as overdone. There's currently a surprising dichotomy that's developed between weak business confidence and stronger consumer confidence. (For more on that subject, tune in to my upcoming Market Snapshot video, which will be available December 7.)
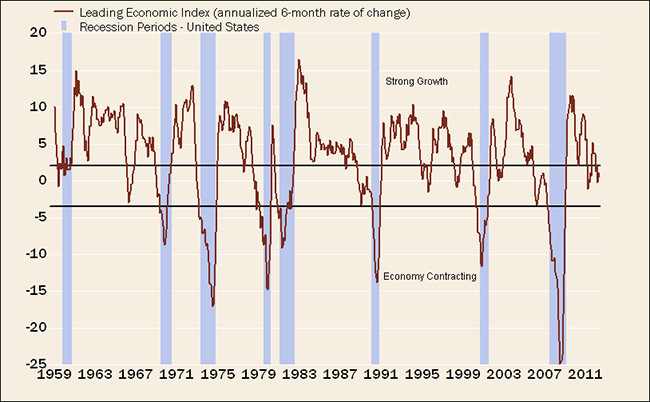
For now, leading economic indicators are not pointing toward recession—but they continue to suggest "stall-speed" growth. The Conference Board's Composite of Leading Economic Indicators just hit a new high for the current expansion. As you can see in the chart and table below, the six-month rate of change in the LEI is consistent with nearly 2% gross domestic product (GDP) growth. Going off the fiscal cliff would almost certainly take the economy into a recession, but the present fundamental picture remains out of the contraction zone.
LEI Says Slow Growth, Not Recession
Source: FactSet, Ned Davis Research (NDR), Inc., as of October 31, 2012. Further distribution prohibited without prior permission. Copyright 2012 © Ned Davis Research, Inc. All rights reserved.

Source: NDR, Inc., as of January 1, 1950-October 31, 2012. Further distribution prohibited without prior permission. Copyright 2012 © Ned Davis Research, Inc. All rights reserved. *Economy represented by Index of Coincident Economic Indicators.
Caution still warranted
We've been cautious about the market for the past few months—initially driven by the elevated optimistic sentiment (a contrarian indicator) that accompanied the summer rally. Concerns about the fiscal cliff easily became the catalyst for selling that only recently ebbed. And although sentiment has improved, as have some technical market conditions, we don't yet feel emboldened to become more aggressive in our stance.
Investors remain pessimistic
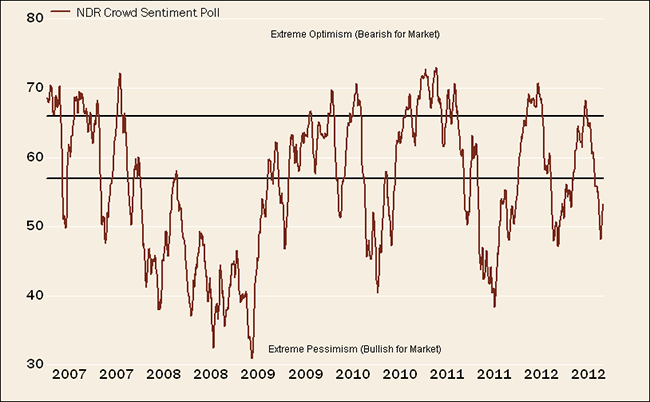
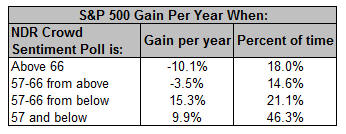
Because it incorporates many distinct sentiment indexes (all of which I look at regularly) into one, I often show the Ned Davis Research Crowd Sentiment Poll:
Investors' Extreme Pessimism Starting to Reverse
Source: FactSet, NDR, Inc., as of November 27, 2012. Further distribution prohibited without prior permission. Copyright 2012 © Ned Davis Research, Inc. All rights reserved.
Source: NDR, Inc., as of January 1, 1995-November 27, 2012. Further distribution prohibited without prior permission. Copyright 2012 © Ned Davis Research, Inc. All rights reserved.
As you can see, pessimism remains in the "extreme" category, though not quite in the zone that's historically been best for market performance—that tends to happen after pessimistic extremes and during early stages of a reversal of that pessimism. We may be on a path toward that zone.
Technically, a mixed bag
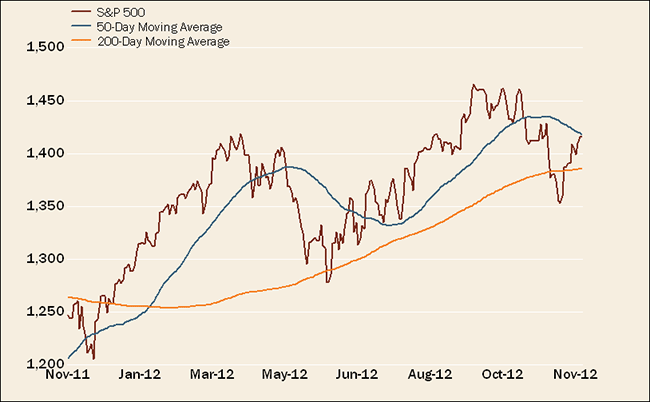
After dipping below its 200-day moving average in November, the S&P 500 Index has climbed back above it and is coming very close to closing above its 50-day moving average.
Stocks Move Back Above Trendlines
Source: FactSet, as of November 30, 2012.
NDR recently pointed out that the market has gotten "back in gear." Between September 25 and November 7, there were three 9-to-1 down days (nine times as many stocks trading down as up on the day) followed by two 9-to-1 up days in the past couple of weeks. Momentum has improved.
Unfortunately, not all technical conditions have improved similarly. Market breadth remains relatively weak, with new highs not quite confirming the market's strength. And the new high in the Dow Industrials has not been confirmed by either the Dow Transports or the Dow Utilities—this is referred to as a Dow Theory divergence.
The net is that the technicals are improving, but are not yet decidedly bullish.
Earnings/valuation … not bad really
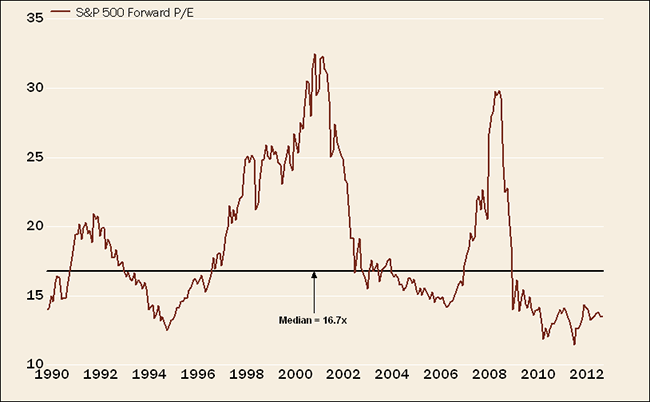
We'll be the first to admit that although valuation on forward earnings for the S&P 500 remains quite inexpensive, the ability to glean the path of forward earnings is hindered by fiscal-cliff implications, among other factors.
Stocks Cheap on Forward Earnings
Source: FactSet, Standard & Poor's, as of November 30, 2012.
Earnings growth clearly decelerated this year, with trends in both bottom-line and top-line growth nearing recession territory. Looking past the fiscal cliff (which is more fun to do than staring into the abyss), it's likely that earnings growth re-accelerates in 2013, albeit remaining in slow-growth mode.
Earnings Likely Troughed ex-Fiscal Cliff
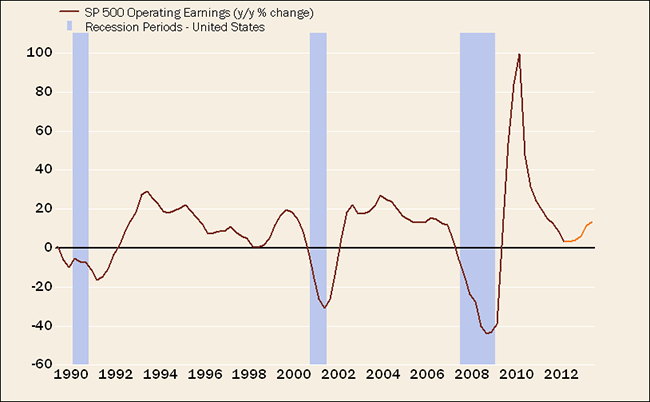
Source: FactSet, Standard & Poor's, as of November 30, 2012. Orange line represents third quarter 2012-fourth quarter 2013 estimates.
Upward revision to GDP shows corporate earnings strength
A lot of attention was given to the recent large upward revision to third-quarter GDP—from 2.0% to 2.8%. There were plenty of critics, given that consumer spending was revised down and inventories up. But nominal GDP was revised up to 5.5%, while unit labor costs remained low at 2.6%.
That means the GDP measure of corporate profits surged nearly 15% quarter-over-quarter and nearly 9% year-over-year. This is much stronger than the S&P's profit growth, which has more of an international bias to it. The strength in US-based, and often smaller, companies bodes well for US hiring and capital spending.
Profit margins could also get a lift next year after being depressed this year by businesses "hoarding" labor. In the past few months, average hours worked has dropped, but companies aren't aggressively reducing their workforces in hopes that the fiscal cliff is resolved. So, as ISI Group rightly points out, if we do fall off the cliff, companies will likely increase layoffs to become lean again, boosting margins. If there is no cliff, hours worked should jump and margins ought to rebound with hours worked, albeit with muted payroll growth.
Coiled springs
None of the above is to suggest a win-win, because when markets are at the mercy of politicians, it's a fool's game to trade around possible outcomes. But we do believe there are some coiled springs that have developed that could begin to uncoil once we get past the machinations over the fiscal cliff. Housing is decidedly on the upswing; global growth, especially in China and other emerging economies, is turning higher again; and the post-Hurricane Sandy rebuilding efforts will be a GDP booster in short order.
Important Disclosures
The components of Index of Coincident Economic Indicators are 1) number of employees on non-agricultural payrolls; 2) personal income excluding transfer payments; 3) industrial production; manufacturing and trade sales.
The information provided here is for general informational purposes only and should not be considered an individualized recommendation or personalized investment advice. The investment strategies mentioned here may not be suitable for everyone. Each investor needs to review an investment strategy for his or her own particular situation before making any investment decision.
All expressions of opinion are subject to change without notice in reaction to shifting market conditions. Data contained herein from third party providers is obtained from what are considered reliable sources. However, its accuracy, completeness or reliability cannot be guaranteed.
Examples provided are for illustrative purposes only and not intended to be reflective of results you can expect to achieve.
Thumbs up / down votes are submitted voluntarily by readers and are not meant to suggest the future performance or suitability of any account type, product or service for any particular reader and may not be representative of the experience of other readers. When displayed, thumbs up / down vote counts represent whether people found the content helpful or not helpful and are not intended as a testimonial. Any written feedback or comments collected on this page will not be published. Charles Schwab & Co. may in its sole discretion re-set the vote count to zero or remove the modules used to collect feedback and votes.


