by Scott Minerd, CIO, Guggenheim Partners LLC
“The official projections are showing scary numbers for the fiscal cliff, but when we dig into the details we see that the real impact will likely be materially less significant. According to the Congressional Budget Office, the fiscal cliff adds up to a total increase in tax revenue of $631 billion, which is approximately 4% of GDP. Going through the report line by line tells a different story. The expiration of the Bush tax cuts for the top 2% of wage earners would amount to $52 billion or roughly 0.3% of GDP. Although raising taxes on top earners will affect their investment decisions over the long-term, it will have little effect on their consumption behavior in the near-term and will not meaningfully impact the economy in 2013. Similarly, raising the capital gains tax will not have a material impact on consumption. Our estimate of the actual impact of a worst-case scenario full dive off the cliff is between 1.5% and 1.8% of GDP based on tallying up the cost of each item. This would be a much more manageable result than what is currently being discounted by the markets.”
Economic Data Releases
U.S. Data Underwhelming, Housing and Manufacturing Disappoint
U.S. third quarter GDP was revised up to 2.7% on a quarter-over-quarter annualized rate, due mainly to growth in inventories and exports. Personal consumption grew 1.4% in the third quarter after a slight downward revision. Housing data was mixed as new home sales unexpectedly shrank 0.3% MoM in October to 368,000, the first decrease since June, while pending home sales surged 5.2% MoM in October. Personal income was flat in October, while personal spending fell 0.2%. Initial jobless claims for the week of November 24th showed the diminishing effect of Sandy as claims dropped 23,000 to 393,000. Manufacturing data disappointed with the ISM index unexpectedly falling to 49.5 in November, the first contraction in three months.
Eurozone Unemployment, Manufacturing Continue Gloomy Reports
Economic data out of Europe showed continuing weakness. The Eurozone unemployment rate for October was 11.7%, increasing on already record levels. November manufacturing PMIs indicated the 16th straight month of contraction for the Eurozone as a whole. Consumer confidence in the region fell to -26.9, the lowest level since May 2009. Conversely, the eurozone business climate index rebounded to a three-month high of -1.19 in November. In Germany, retail sales fell 2.8% in October, the largest monthly decline since March 2011. In Asia Pacific, data in China showed the recent rebound in economic activities continues, with the official manufacturing PMI rising to a seven-month high of 50.6 and the HSBC manufacturing PMI rising to a 13-month high of 50.5 in November. Japanese industrial production surprised with monthly growth in October of 1.8%. The Reserve Bank of Australia lowered its benchmark interest rate by 50 basis points, the lowest level since September 2009.
Chart of the Week
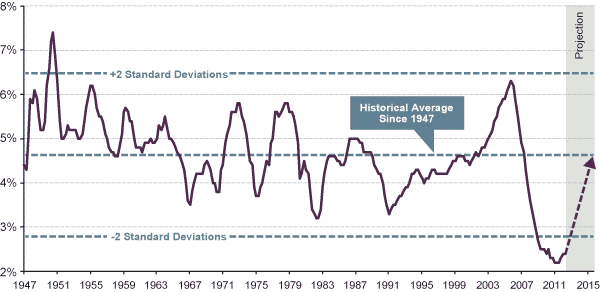
Private Residential Investment: Share of Nominal GDP
Private residential investment, a measurement of expenditures on housing activities, has historically accounted for about 4.6% of economic output over the past 65 years. Since the height of the housing boom in 2006, its share of economic output had dropped from a peak of 6.3% in 4Q2005 to 2.2% in 3Q2011, the lowest level since 1947. Over the past four quarters, private residential investment has contributed 0.3% on average to real GDP growth, but its latest share to GDP remains at a low of 2.5%. Based on our projection, if housing expenditures were to revert back to historical norms by 2015, it would add an additional 0.7% to economic growth every year. This could offset approximately 40% of the negative shock from the fiscal cliff under the worst case scenario.

Source: Haver, Guggenheim Investments. Actual Data as of 3Q2012.
This article is distributed for informational purposes only and should not be considered as investing advice or a recommendation of any particular security, strategy or investment product. This article contains opinions of the author but not necessarily those of Guggenheim Partners or its subsidiaries. The author’s opinions are subject to change without notice. Forward looking statements, estimates, and certain information contained herein are based upon proprietary and non-proprietary research and other sources. Information contained herein has been obtained from sources believed to be reliable, but are not assured as to accuracy. No part of this article may be reproduced in any form, or referred to in any other publication, without express written permission of Guggenheim Partners, LLC. ©2012, Guggenheim Partners.
Past performance is not indicative of future results. There is neither representation nor warranty as to the current accuracy of, nor liability for, decisions based on such information.
Copyright © Guggenheim Partners LLC


