Weekly Select Sector SPDRs Review
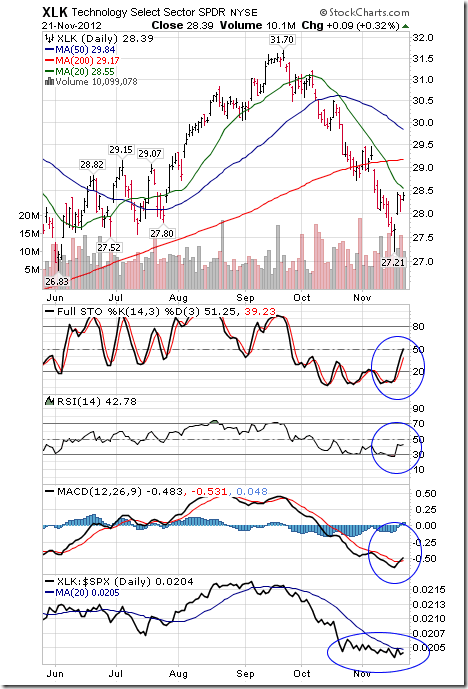
Technology
· Intermediate trend is down.
· Units trade below their 20, 50 and 200 day moving averages.
· Short term momentum indicators are recovering from oversold levels.
· Strength relative to the S&P 500 Index remains negative.
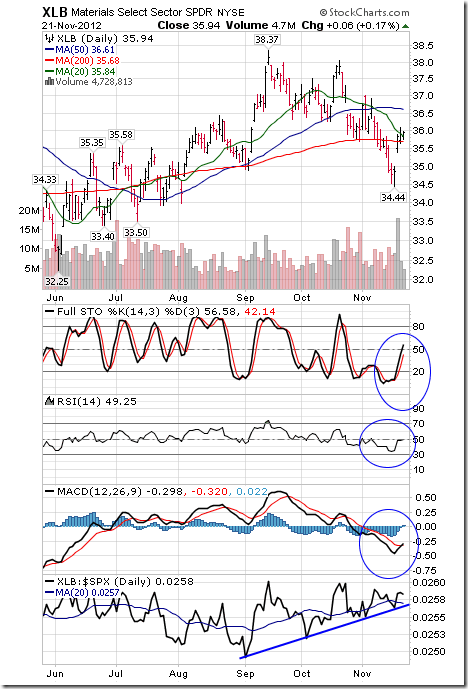
Materials
· Intermediate trend is down.
· Units moved above their 20 and 200 day moving average
· Short term momentum indicators are recovering from oversold levels.
· Strength relative to the S&P 500 Index remains positive.
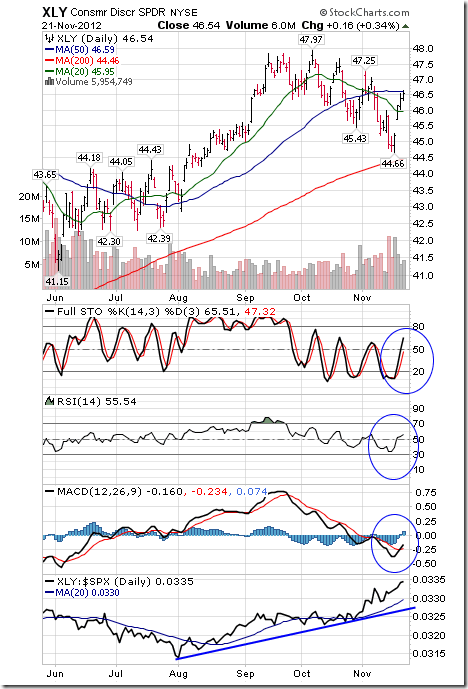
Consumer Discretionary
· Intermediate trend is down.
· Units moved above their 50 day moving average
· Short term momentum indicators are recovering from oversold levels.
· Strength relative to the S&P 500 Index remains positive.
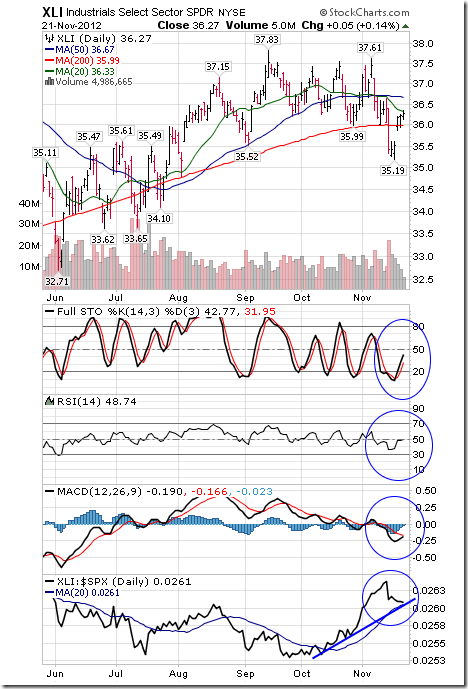
Industrials
· Intermediate trend is down.
· Units moved above their 200 day moving average
· Short term momentum indicators are recovering from oversold levels.
· Strength relative to the S&P 500 Index is positive, but showing possible signs of change
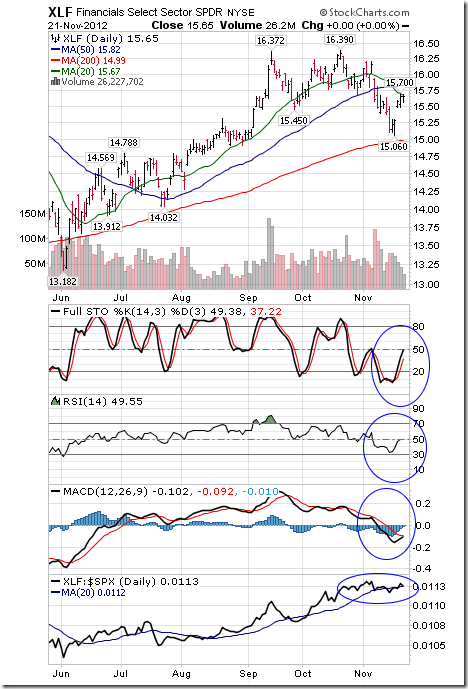
Financials
· Intermediate trend is down.
· Units remain above their 200 day moving average and below their 20 and 50 day moving averages.
· Short term momentum indicators are recovering from oversold levels.
· Strength relative to the S&P 500 Index has changed from positive to neutral.
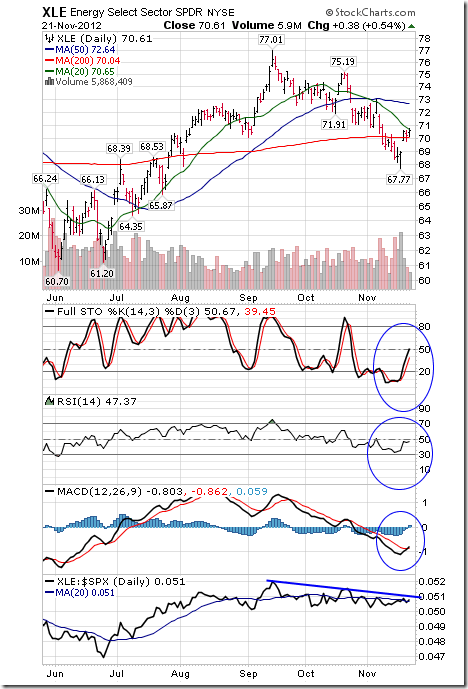
Energy
· Intermediate trend is down.
· Units moved above their 200 day moving average, but remain below their 20 and 50 day moving averages.
· Short term momentum indicators are recovering from an oversold level.
· Strength relative to the S&P 500 Index remains slightly negative.
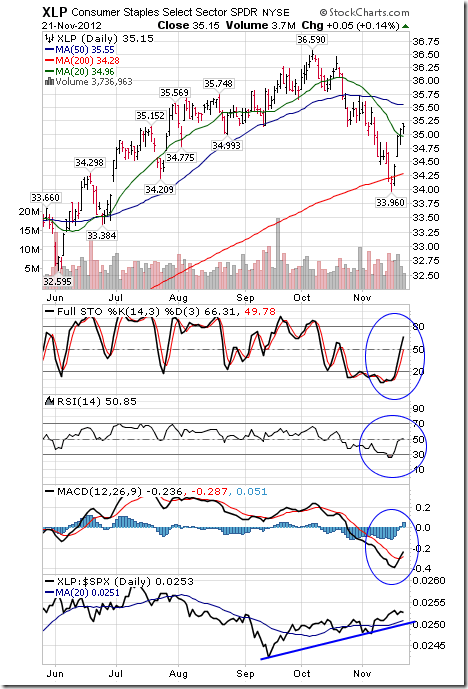
Consumer Staples
· Intermediate trend is down.
· Units remain above their 200 day moving average and moved above its 20 day moving average.
· Short term momentum indicators are recovering from oversold levels.
· Strength relative to the S&P 500 Index remains positive.
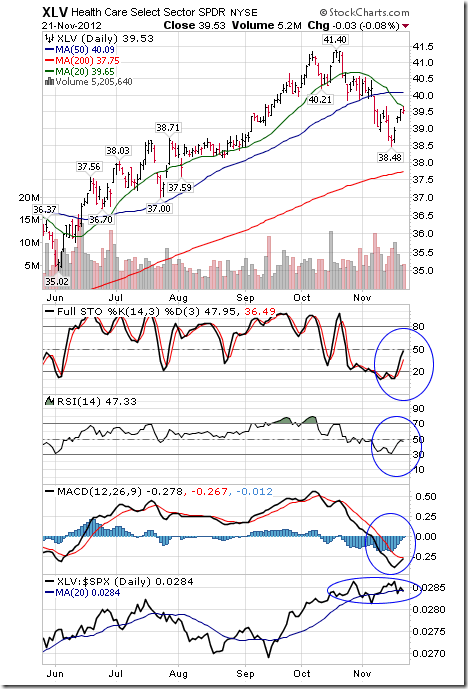
Health Care
· Intermediate trend is down.
· Units remain above their 200 day moving average, but below its 20 and 50 day moving averages.
· Short term momentum indicators are recovering from oversold levels.
· Strength relative to the S&P 500 Index has changed from up to neutral.
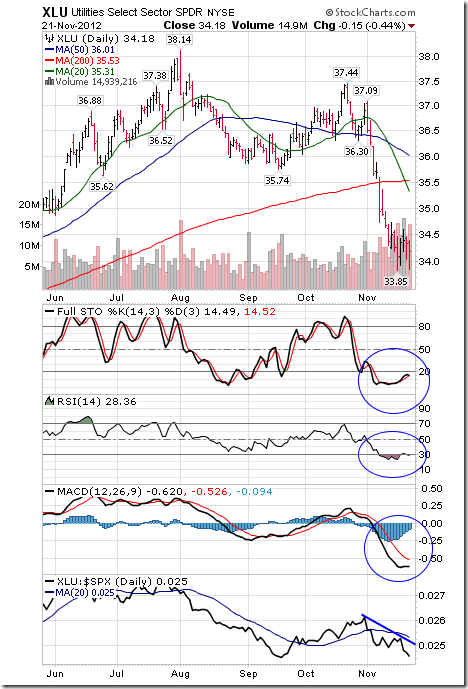
Utilities
· Intermediate trend is down.
· Units remain below their 20, 50 and 200 day moving averages.
· Short term momentum indicators are oversold and showing early signs of bottoming.
· Strength relative to the S&P 500 Index remains negative.
Eric Wheatley’s Listed Options Column
Eric Wheatley’s Listed Options Column
Preamble: In the eventuality that anyone had noticed that my commentary wasn’t up last week, I goofed by sending it last Thursday to my Boss and most frequent addressee, Mr. John C. Hood, instead of Don. The fact that this week has Thursday Thanksgiving day football wasn’t AT ALL considered by my subconscious mind. I think. Oh well, I had a week off from writing, the Pats, Jets and Texans are all playing and two-fours of Corona are on sale this week at Loblaws. I deserve this.
*****************
Good morning folks,
As is my wont and editorial prerogative, this’ll be a slightly deranged essay, beginning with a story from my life overseas and ending with options stuff. The mentally stable and habitually impatient should scroll down to more relevant content provided by normal persons. Thanks.
I started 2012 carrying a couple dozen extra kilos on my frame which I had accumulated in Algeria. When I was over there, I had found a really wonderful gym not far from my villa at the Martyrs’ Monument mall, where women and men respectfully intermingled and sweated together whilst wearing revealing clothing (not a usual occurrence over there). The aerobics instructor played the same goshdarned Michael Jackson mix tape every evening, so I probably mortgaged my eardrums’ long-term health by turning up the volume on my MP3 player. Good memories.
There was a slight problem though: the gym was only open evenings and I’m a morning person. Towards the end of my 20-month stay, I’d come home after spending my working days dealing with civil servants and aggressively carving through horrendous rush-hour traffic and, every evening, had to face an increasingly futile choice: waiting an hour to head back out into the traffic and get my hindquarters to the gym or crack open the first of many half-litre cans of Beck’s and crash with ESPN World. You’ll understand that an overlong stay in a foreign land made this an unfortunately easy choice and I carried an impressive beer gut back home.
I’ve now lost the belly and religiously go to the gym every morning. As I was on the elliptical yesterday, I thought of an interesting and hopefully intuitive way of illustrating how time value erosion works in options.
I’ve often heard some weird things from people who fail to grasp how time value works. “I bought a call, the stock went up and the call’s price barely budged! Somebody’s manipulating the market!” is an example of the kind of comments I’ve had to field for years. The basic fact is that long-dated out-of-the-money options don’t really follow the price of the underlying stock all that faithfully (they have relatively little delta). Why? Because there is a lot of time left, so many things can happen between now and the option’s expiry.
When I’m on my elliptical, I want to do a minimum of 150 strides per minute (represented here with “SPM”. Francophones are giggling) and I spend 30 minutes on the machine, so my goal is to get to 4,500 strides. Now, my tempo is random, determined by the song which comes up next on my MP3 player. Some songs have low tempos, others higher (suprisingly, songs by Ted Nugent, the Silversun Pickups and my favourite death metal tune – no link provided for obvious reasons – wind up being low-tempo songs, whereas The Beatles’ Norwegian Wood and a seemingly slow Alice In Chains song are quite high tempo on the elliptical. Go figure).
(…and yes, my musical tastes for the gym are somewhat eclectic).
Let’s say I start out with a high tempo song and hold onto an SPM of 160 for the first five minutes. That means I’m at 800 strides instead of my goal of 750. I’ve therefore gained fifty extra strides, which gives me some wiggle room and will allow me not to skip a slower-tempo song I like which may come up later on. Unfortunately, I’ve still got 25 minutes left. That 50 extra strides therefore only represents two strides per minute, bringing my needed average SPM only down to 148 from 150; a negligible difference. Let’s say I’m still at 50 strides above expectations at the 25-minute mark, then I’ll have a comfortable 10 SPM cushion; because there are only five minutes left, I only need to hold onto an SPM of 140 to meet my goal.
This resembles what happens to an out-of-the-money option when there is a move in the stock. For example, if I buy an XYZ March 50 call for $3.00 when the stock is at $45 then XYZ moves to $50, the call won’t go up as much as you would think. It may gain two or three dollars, perhaps less. The November XYZ 50 calls which are expiring next week however would be much more sensitive to the move in the price of the stock, because they would go from being deep out-of-the-money to at-the-money (i.e. from worthless to relatively valuable).
This is why, when I discuss the purchase of options for speculative purposes, I always state that you should buy the amount of time you need, no more. If you buy too much time, even if you’re right and the stock moves in the desired direction, your option won’t be moving as much as if you had bought a shorter-term option.
And these are the types of things you think about at the gym when you’re on the cusp of turning 40 and keeping your eyes closed for fear of catching an accidental glimpse of a twentysomething woman and coming across as a massively creepy sweaty old letch.
*****************
A few articles from the Twitter feed from this week:
· Managing American entitlements. I appreciated this article because it avoided most of the usual rhetoric surrounding the subject.
· Short and sweet. The two biggest risks in the markets.
· Eight reasons why the fiscal cliff will (hopefully) be addressed.
In this (actually, last) week’s French-language blog: hunting bears with chainsaws and other paths not taken.
Cheers!
Éric Wheatley, MBA, CIM
Associate Portfolio Manager, J.C. Hood Investment Counsel Inc.
eric@jchood.com
514.604.2829;1.855.348.2829
Twitter: @jchood_eric_en
Blogue en français : gbsfinancier.blogspot.ca
*****************
Little known fact about John Charles Hood #51
Norwegian Wood is about John Charles Hood’s legendary 1964 visit to Trondheim.
FP Trading Desk Headline
FP Trading Desk headline reads, “Will the fiscal cliff spoil Christmas”? Following is a link to the report:
http://business.financialpost.com/2012/11/22/will-the-fiscal-cliff-spoil-christmas/
Special Free Services available through www.equityclock.com
Equityclock.com is offering free access to a data base showing seasonal studies on individual stocks and sectors. The data base holds seasonality studies on over 1000 big and moderate cap securities and indices.
To login, simply go to http://www.equityclock.com/charts/
Following is an example:
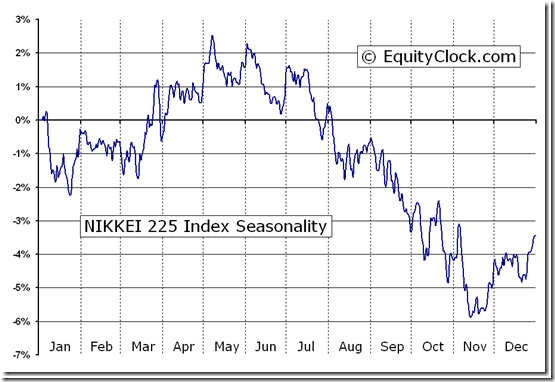
NIKKEI 225 Index (^N225) Seasonal Chart
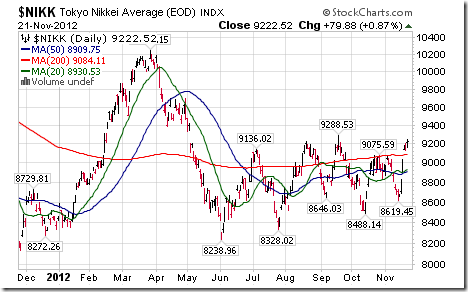
Editor’s Note: Not surprising, seasonality of the Nikkei Average is similar to the seasonality of other major international equity indices: Buy in early November and sell in early May. Favourable seasonal influences starting in early November once again have appeared. The Nikkei closed yesterday at six month high.
Disclaimer: Comments and opinions offered in this report at www.timingthemarket.ca are for information only. They should not be considered as advice to purchase or to sell mentioned securities. Data offered in this report is believed to be accurate, but is not guaranteed.
Don and Jon Vialoux are research analysts for Horizons Investment Management Inc. All of the views expressed herein are the personal views of the authors and are not necessarily the views of Horizons Investment Management Inc., although any of the recommendations found herein may be reflected in positions or transactions in the various client portfolios managed by Horizons Investment Management Inc
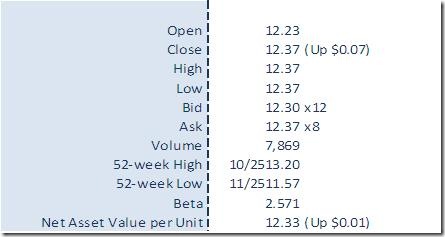
Horizons Seasonal Rotation ETF HAC November 22nd 2012


