by Don Vialoux, TechTalk
Upcoming US Events for Today:
- Weekly Jobless Claims will be released at 8:30am. The market expects Initial Claims to show 376K versus 355K previous.
- Consumer Price Index for October will be released at 8:30am. The market expects a month-over-month increase of 0.1% versus 0.6% previous. Core CPI is expected to show an increase of 0.2% versus an increase of 0.1% previous.
- The Empire State Manufacturing Index for November will be released at 8:30am. The market expects –5.0 versus –6.2 previous.
- The Philadelphia Fed Index for November will be released at 10:00am. The market expects 4.5 versus 5.7 previous.
- Weekly Crude Inventories will be released at 11:00am.
Upcoming International Events for Today:
- Germany GDP for the Third Quarter will be released at 2:00am EST. The market expects a year-over-year increase of 0.8% versus 1.0% previous.
- Great Britain Retail Sales for October will be released at 4:30am EST. The market expects a year-over-year increase of 1.6% versus 2.5% previous.
- Euro-Zone GDP for the Third Quarter will be released at 5:00am EST. The market expects a year-over-year decline of 0.7% versus a decline of 0.4% previous.
- Euro-Zone Consumer Price Index for October will be released at 5:00am EST. The market expects a year-over-year increase of 2.5% versus an increase of 2.6% previous.
The Markets
Stocks plunged on Wednesday amidst concerns pertaining to the unrest in the Middle East and fear over the pending fiscal cliff. According to CNNMoney.com, “Israel launched a series of blistering air strikes Wednesday on what it said are terrorist targets in Gaza. The attacks killed the chief of Hamas’ military wing and at least eight others, Israeli and Palestinian officials said. In response, Hamas’ military division warned that Israelis had opened "the gates of hell on themselves" with the move.” Investors bid up the price of Oil following the attacks as concern rose that disruptions in production will result. Economically sensitive stocks were the hardest hit, including those pertaining to Industrials and Materials. Albeit not immune to the equity declines, the technology sector outperformed the market on the session, helped by positive action in Cisco, which reported strong earnings the night prior.
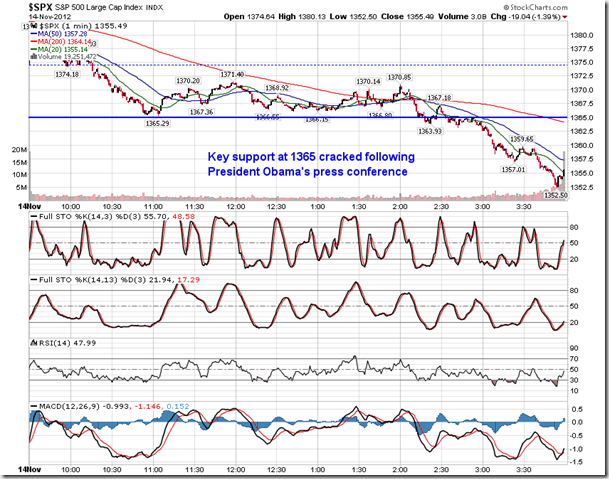
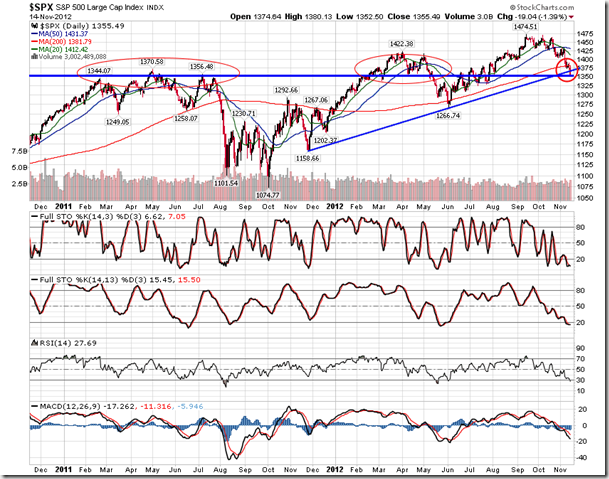
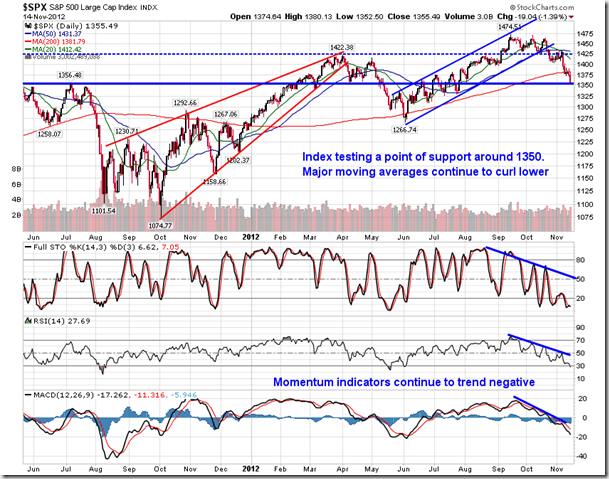
Readers of this site will know that we’ve been looking to 1365 on the S&P 500 as support. Having found support at this level mid-day on Wednesday, the level quickly cracked following the President’s press conference, which failed to calm “fiscal cliff” nerves. This break is very concerning as it not only pushes the large cap benchmark firmly below the 200-day moving average, but it also breaks one of the final levels of trendline support dating back to around this time last year. The benchmark ended at a level that the market has shown a history of deriving topping patterns around over the past couple of years. A horizontal level of support around 1350 constrained the upward momentum in 2011 and temporarily supported the market peak earlier this year. Momentum indicators are significantly oversold with RSI pushing below 30, a situation that has only occurred two other times since the 2009 low. Each time the index has become this oversold according to the Relative Strength Index, the benchmark has bottomed soon thereafter, rebounding higher in the months that followed.
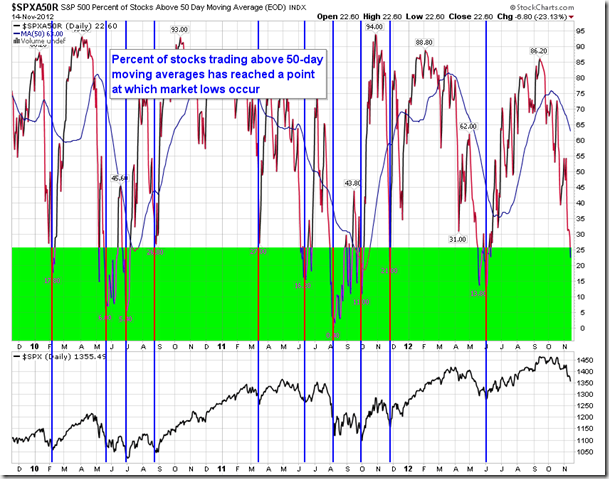
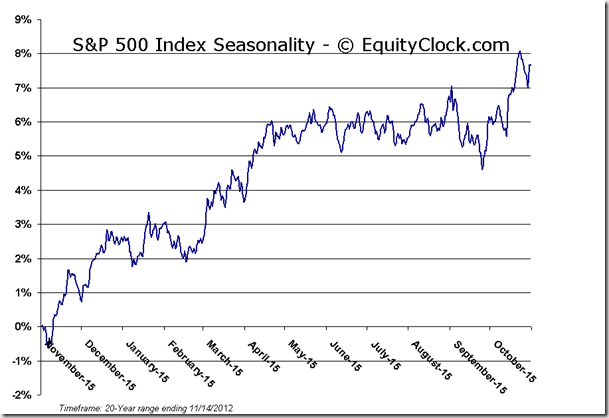
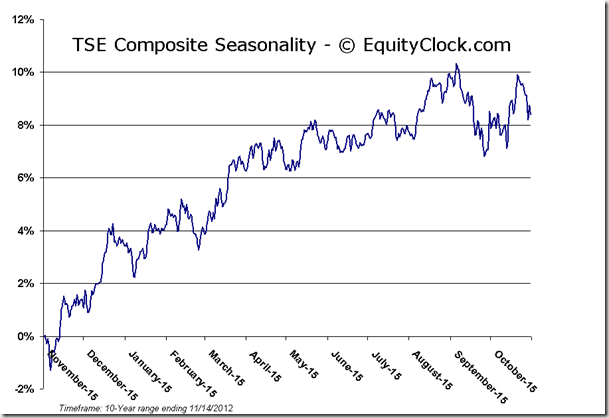
Emphasizing the oversold conditions of the market are the percent of stocks in the S&P 500 index that are trading above 50-day moving averages. We had previously pointed out the crossover of this indicator below the 50-day moving average as a signal to sell as losses typically follow. Now the indicator has reached a point in which market lows have been formed. Currently around 22% of stocks within the S&P 500 are trading above 50-day moving averages. As the indicator reaches around 25% or lower, the market is indicated to be sufficiently oversold that a snapback rally typically results. The bounces that have followed upon rebound from the oversold state have lasted at least one month. Gains from the oversold low to the peak of the subsequent rally have averaged 13.7% over the past three years. Bottom line is that a number of technical indicators are suggesting that the market is extremely oversold and, as a result, the risk-reward ratio of the market favours the upside potential over the near-term rather than the downside risks. Selling momentum is likely reaching a point of exhaustion, which can create lucrative trading opportunities, particularly as markets enter a seasonally favourable time surrounding the US Thanksgiving next week.
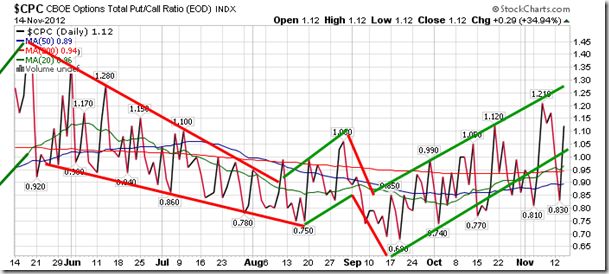
Sentiment on Wednesday, as gauged by the put-call ratio, ended bearish at 1.12.
Chart Courtesy of StockCharts.com
Chart Courtesy of StockCharts.com
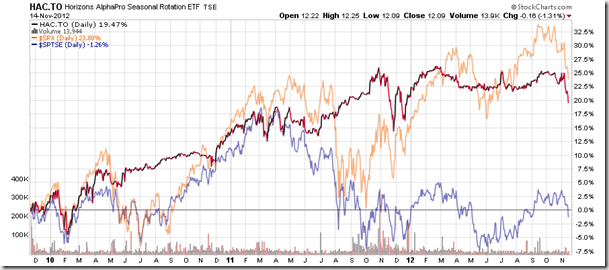
Horizons Seasonal Rotation ETF (TSX:HAC)
- Closing Market Value: $12.09 (down 1.31%)
- Closing NAV/Unit: $12.03 (down 1.75%)
Performance*
| 2012 Year-to-Date | Since Inception (Nov 19, 2009) | |
| HAC.TO | -1.21% | 20.3% |
* performance calculated on Closing NAV/Unit as provided by custodian
Click Here to learn more about the proprietary, seasonal rotation investment strategy developed by research analysts Don Vialoux, Brooke Thackray, and Jon Vialoux.


