Upcoming US Events for Today:
- Weekly Crude Inventories will be released at 10:30am.
- Consumer Credit for September will be released at 3:00pm. The market expects $10.2B versus $18.1B previous.
Upcoming International Events for Today:
- Euro-Zone Retail Sales for September will be released at 5:00am EST. The market expects a year-over-year decline of 0.8% versus a decline of 1.3% previous.
- German Industrial Production for September will be released at 6:00am EST. The market expects a year-over-year decline of 0.4% versus a decline of 1.4% previous.
- Japanese Machine Orders for September will be released at 6:50pm EST. The market expects a year-over-year decline of 4.9% versus a decline of 5.6% previous.
The Markets
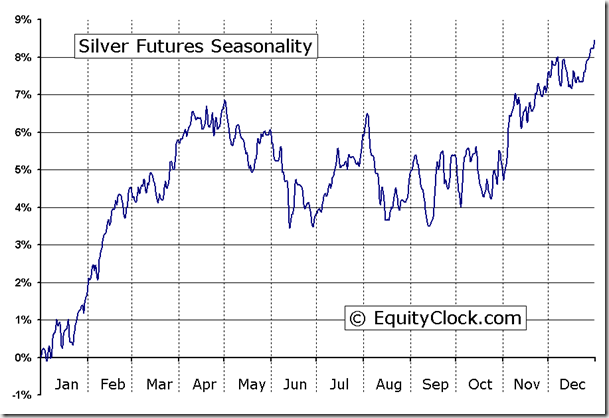
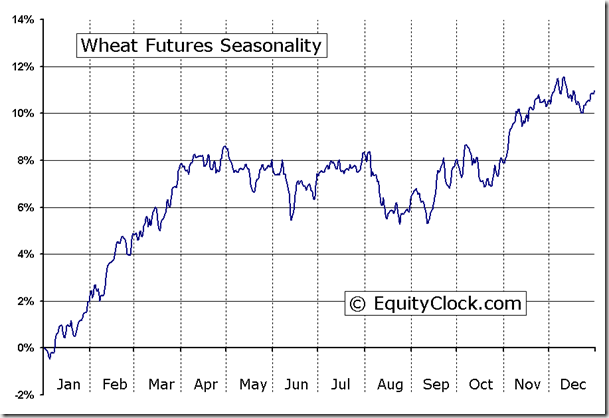
Markets traded higher on Tuesday as US citizens went to the polls to vote for the next President. Investors are anxious to finally receive clarity on the direction of leadership in the US, something that will likely become known by the time markets open on Wednesday. At the time of writing, Barack Obama has been projected to be the winner and reaction has primarily been realized in the US Dollar, as well as commodity markets. The US dollar index declined on the result, while Gold and Silver surged higher. A victory by the current President is assumed to maintain current monetary policies enacted by Ben Bernanke, which would be dollar bearish and commodity bullish as inflation expectations grow under current quantitative easing initiatives. The two best commodities to own during the fourth quarter on a seasonal basis are Silver and Wheat. Each produces gains between late October and early April. Commodities generally find broader seasonal strength into the first quarter of the year as industrial production plays a more dominant theme.
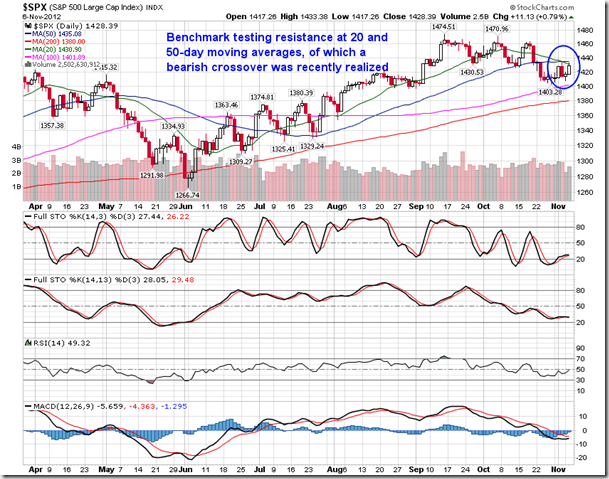
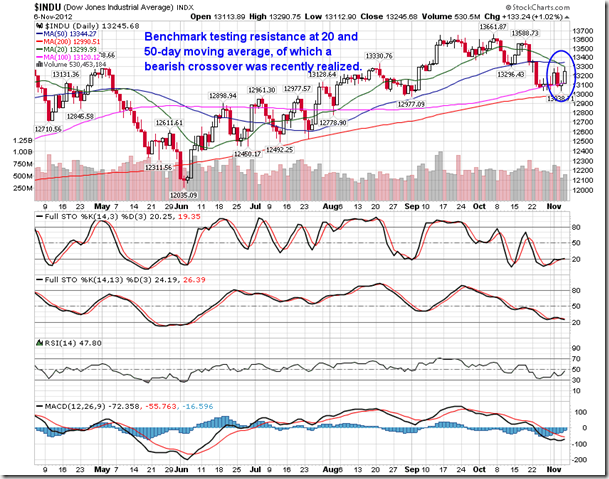
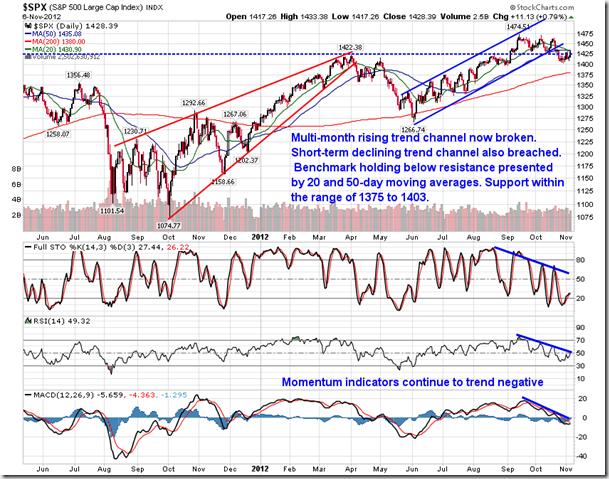
Turning to the stock markets, strong gains were realized by both the Dow Jones Industrial Average and S&P 500 during Tuesday’s session. Both benchmarks tested resistance at 20 and 50-day moving averages, which have just recently converged in a bearish crossover manner. A breakout back above these levels would likely drag sidelined cash back into this market, but, until then, investors may be looking for confirmation of support. Equity indices in the US charted a low in the last few days of October and have traded flat for the last 9 trading sessions, hinting of short-term support at a level that is approximately equivalent to the 100-day moving average. Equity indices remain in a short-term negative trend that will not be confirmed broken until mid-October’s high, around 1465 on the S&P 500, is surpassed.
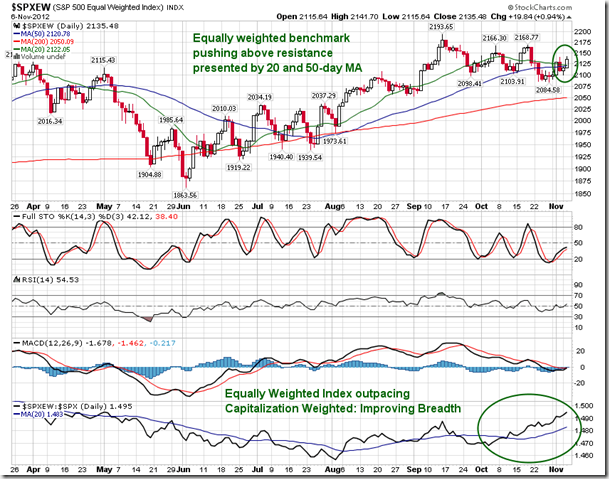
It is no doubt that shares of Apple have acted as a drag on the market as declines in the largest individual holding within US benchmarks hinder equity performance. Declines were realized yet again within this tech titan on Tuesday, even as equity markets traded higher. The question becomes, can equity markets trade higher despite the weakness in this one influential issue. The answer is yes. Breadth, as gauged by the relative performance of the S&P 500 equally weighted index versus the capitalization weighted index, has been trending higher in the midst of the market declines over the past month. Positive relative performance of the equally weighted index is generally bullish for equities as a broad spectrum of stocks show signs of outperformance compared to the market, leading to gains in equity benchmarks. Unlike it’s capitalization counterpart, the S&P 500 equally weighted index moved above its 20 and 50-day moving averages on Tuesday, hinting of further upside ahead.
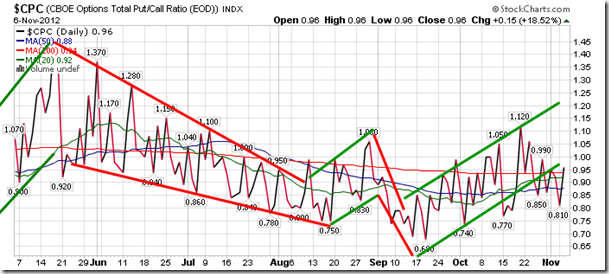
Sentiment on Tuesday, as gauged by the put-call ratio, ended close to neutral at 0.96. Despite the bullish price action within equities, investors remained cautious ahead of receiving results from the election. Stocks were purchased along with protective put options in order to prepare for a bullish or bearish outcome as investors chose not to place any significant bets in either direction. The trend of the ratio continues to show signs of changing from positive to negative, which would suggest decreasing investor pessimism, which is bullish for equities.
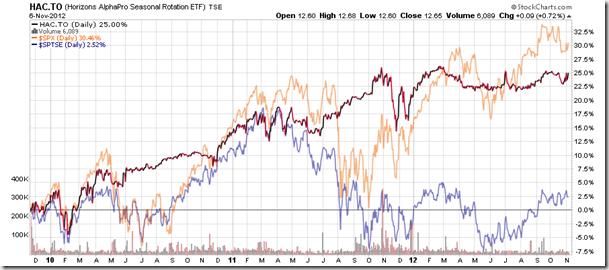
Chart Courtesy of StockCharts.com
Chart Courtesy of StockCharts.com
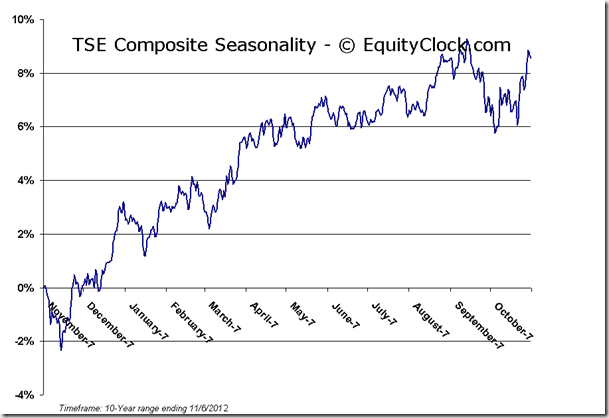
Horizons Seasonal Rotation ETF (TSX:HAC)
- Closing Market Value: $12.65 (up 0.72%)
- Closing NAV/Unit: $12.63 (up 0.78%)
Performance*
| 2012 Year-to-Date | Since Inception (Nov 19, 2009) | |
| HAC.TO | 3.72% | 26.3% |
* performance calculated on Closing NAV/Unit as provided by custodian
Click Here to learn more about the proprietary, seasonal rotation investment strategy developed by research analysts Don Vialoux, Brooke Thackray, and Jon Vialoux.


