SIA Charts Daily Stock Report (siacharts.com)
The SIA Daily Stock Report utilizes a proven strategy of uncovering outperforming and underperforming stocks from our marquee equity reports; ttie S&P/TSX 60, S&P/TSX Completion and S&P/TSX Small cap We overlay these powerful reports with our extensive knowledge of point and figure and candlestick chart signals, along with other western-style technical indicators to identity stocks as they breakout or breakdown. In doing so we provide our Elite-Pro Subscribers with truly independent coverage of the Canadian stock market with specific buy and sell trigger points.
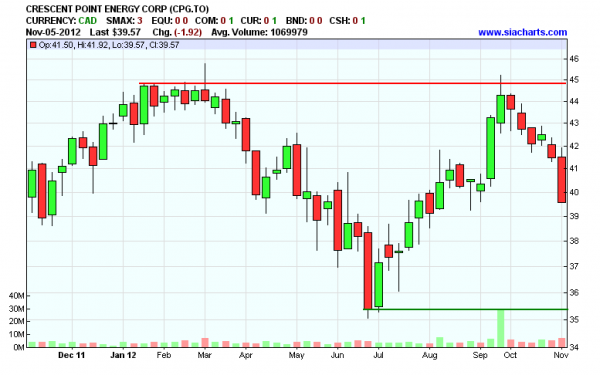
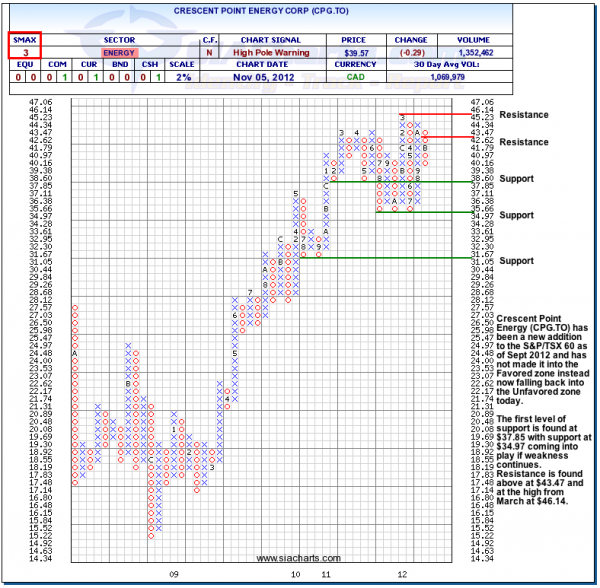
Crescent Point Energy (CPG.TO) has been a new addition to the S&P/TSX60 as of Sept 2012 and has not made it into the Favored zone instead now falling back into the Unfavored zone today.
The first level of support is found at $37.85 with support at $34.97 coming into play if weakness continues, Resistance Is found above at $43.47 and at the high from March at $46.14.
Green - Favoured Zone
Yellow - Neutral Zone
Red - Out of Favour Zone
Important Disclaimer
SIACharts.com specifically represents that it does not give investment advice or advocate the purchase or sale of any security or investment. None of the information contained in this website or document constitutes an offer to sell or the solicitation of an offer to buy any security or other investment or an offer to provide investment services of any kind. Neither SIACharts.com (FundCharts Inc.) nor its third party content providers shall be liable for any errors, inaccuracies or delays in content, or for any actions taken in reliance thereon.
Copyright © siacharts.comCopyright © siacharts.com


