SIA Charts Daily Stock Report (siacharts.com)
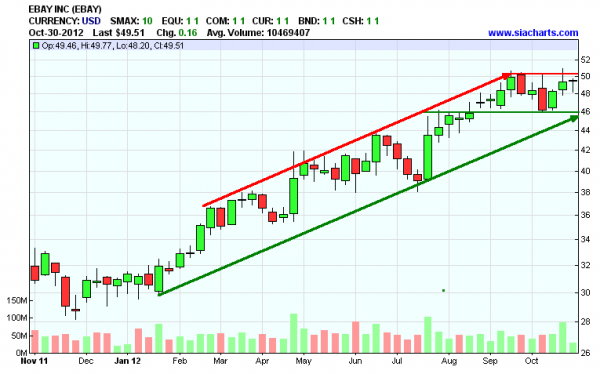
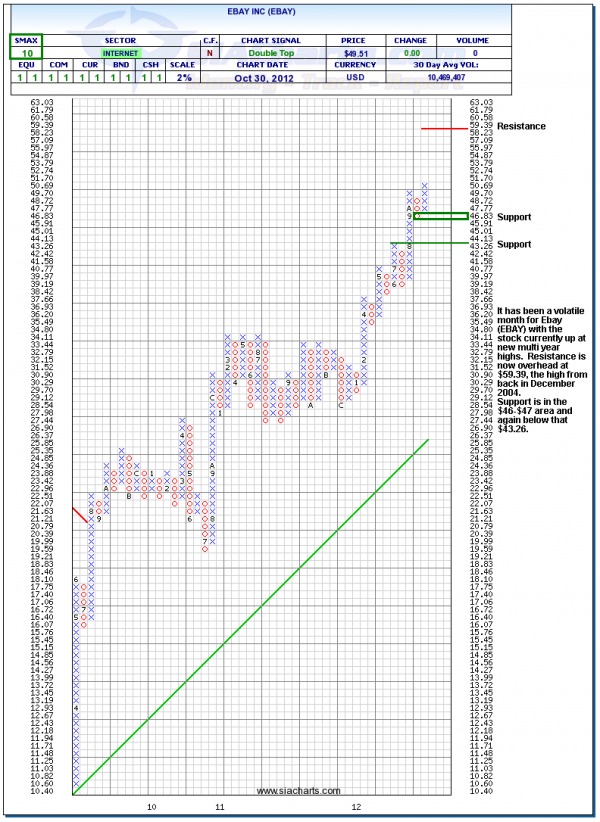
EBAY INC (EBAY) NASDAQ - Oct 31, 2012 - It has been a volatile month for Ebay (EBAY) with the stock currently up at new multi year highs. Resistance is now overhead at $59.39, the high from back in December 2004.
Support is in the $46-$47 area and again below that $43.26.
Green - Favoured Zone
Yellow - Neutral Zone
Red - Out of Favour Zone
Important Disclaimer
SIACharts.com specifically represents that it does not give investment advice or advocate the purchase or sale of any security or investment. None of the information contained in this website or document constitutes an offer to sell or the solicitation of an offer to buy any security or other investment or an offer to provide investment services of any kind. Neither SIACharts.com (FundCharts Inc.) nor its third party content providers shall be liable for any errors, inaccuracies or delays in content, or for any actions taken in reliance thereon.
Copyright © siacharts.com


