by SIA Charts (siacharts.com)
For this week's SIA Equity Leaders Weekly, we are going to take a closer look at the U.S. Dollar Currency exchange and also looking at the 30-Year Interest Rate again. With the continued recent market channeling/indecision, is important to keep track of key relationships that may be affecting or signaling the movement in the markets.
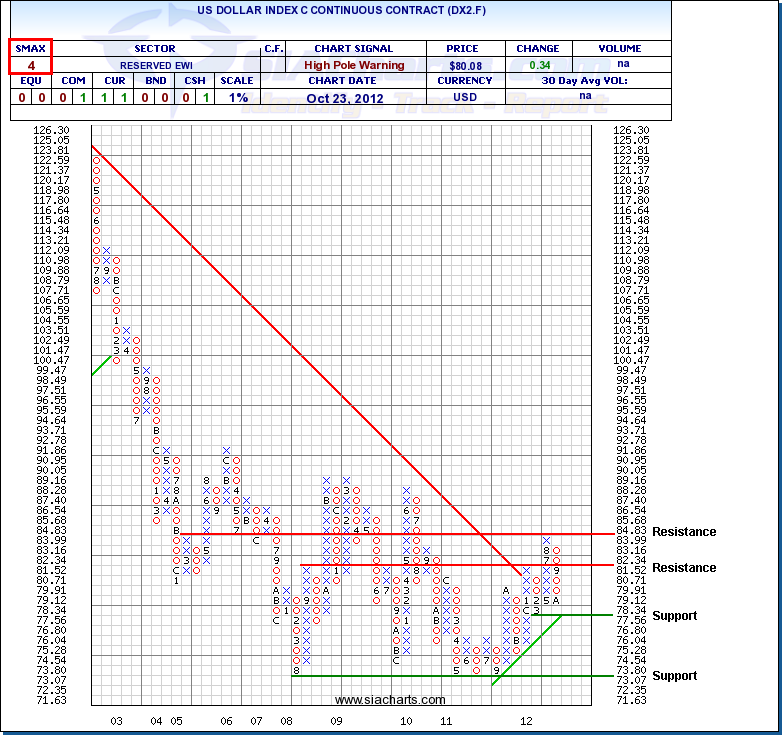
U.S. Dollar Index Continuous Contract (DX2.F)
With the strength of U.S. Equities over the past couple of months, both the NASD.I and the SPX.I have moved on to new 52-week highs and the DX2.F has responded inversely with a 6% negative move. This broke through a prior support level and is moving towards another one at $77.56, which also corresponds with the rising trendline. Should this break, further support can be found at $73.07. This is a level that for the DX2.F, should be material, as it has failed to move below this level over the past decade on four prior attempts.
Resistance is overhead at $82.34 and again above that at $84.83. As we have been monitoring this chart closely, the SMAX has weakened further to a score of 4 out of 10 on September 19th. The weakening U.S. Dollar could explain the short-term pullback favoring the TSX.I over the SPX.I recently.
Click on Image to Enlarge
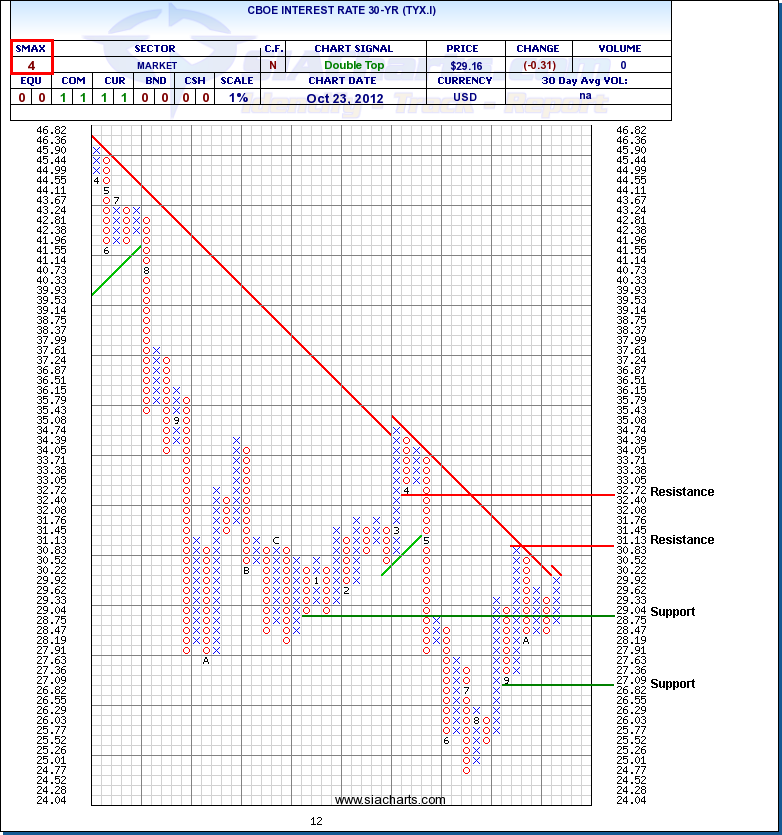
CBOE Interest Rate 30-Year (TYX.I)
We continue to monitor the U.S. CBOE 30-Year Yield very closely as it has now twice attempted to break through the downward trend line and resistance level recently, but has failed to move up through it. A move up through the downwards trend line could have TYX.I meet resistance at 3.113%. With further resistance found at 3.272%.
Support is now found at 2.875% from the recent move. Further support is found at the low from last month at 2.682% should the weakness continue.The SMAX has not changed with a score of 4 out of 10 showing weakness against the asset classes of Equities, Bonds, and Cash.
Click on Image to Enlarge
Important Disclaimer
SIACharts.com specifically represents that it does not give investment advice or advocate the purchase or sale of any security or investment. None of the information contained in this website or document constitutes an offer to sell or the solicitation of an offer to buy any security or other investment or an offer to provide investment services of any kind. Neither SIACharts.com (FundCharts Inc.) nor its third party content providers shall be liable for any errors, inaccuracies or delays in content, or for any actions taken in reliance thereon.
Copyright © siacharts.com


