October 24, 2012
by John Wightkin, Director of Equity Research Applications, Schwab Center for Financial Research
Key Points
- Stocks with higher dividend yields and lower price volatility are often thought of as "safe" stocks, but in the current environment, that may no longer be the case.
- In a quest for investment income, investors have pushed the valuation of higher-yielding stocks to their priciest levels in years.
- Valuation concerns could also be surfacing in several of the more-defensive sectors, such as utilities.
Stocks with higher dividend yields and lower price volatility are often thought of as "safe" stocks—especially stocks in defensive sectors such as utilities. It's not surprising that these types of stocks have been popular over the past few years, given still-fresh memories of the severe bear market, low interest rates and uncertainty surrounding the US economy and the European sovereign debt crisis.
In this search for yield and less price variability, however, a new risk could potentially develop: valuation risk. This may yield unpleasant surprises for investors. Think of a popular restaurant: from the outside, it may appear to be a blessing to the owner. However, crowded tables and long wait times might introduce other problems for the owner and employees that aren't obvious to patrons.
Let's examine valuation risk in a bit more detail and see how we might manage it.
Valuation matters
Valuation risk is an investment tenet investors sometimes misunderstand or ignore. It occurs when a stock becomes overvalued relative to its underlying fundamentals, which can increase the likelihood of it underperforming less-expensive stocks going forward.
Research we conducted has shown that stocks with price/earnings (P/E) ratios in the top 20% of all stocks underperformed, on average, stocks with P/E ratios in the lowest 20% by close to 4% annually.1
So historically, paying up for stocks has often led to disappointments.
Dividend valuations
What does this mean for dividend-paying stocks? Plenty. In a quest for investment income, investors have pushed the valuation of higher-yielding stocks to their priciest levels in years.
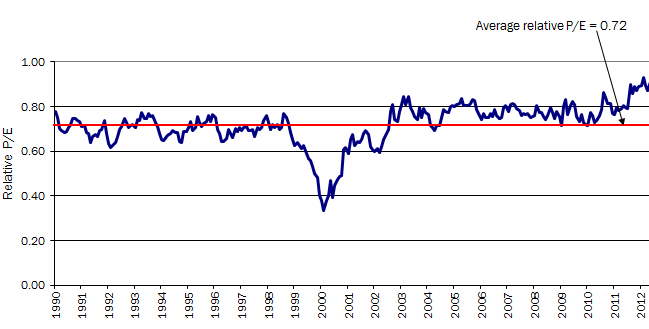
To illustrate this point, we divided the top 1,500 stocks by market capitalization into five segments based on their current dividend yield. We then measured the median P/E (based on trailing 12-month earnings) for each segment. We conducted this analysis for each month from January 1990 to July 2012.
The chart below shows the ratio of the median P/E for the highest-yielding stock segment (High Yield) to the median P/E for the market (the top 1,500 stocks ranked by market cap). A reading of 0.8, for example, means that the P/E for High Yield is 80% of the market; that is, it trades at a 20% valuation discount. A higher ratio also indicates a richer relative valuation for the highest-yielding stocks.
High-Yield P/E Divided by Larger Market P/E

Source: Schwab Center for Financial Research, data from January 31, 1990 through July 31, 2012. Larger market defined as top 1,500 stocks by market capitalization.
Normally, as the graph demonstrates, High Yield has traded at close to a 30% valuation discount to the overall market. The reason is that higher-yielding stocks are usually associated with more-mature, slower-growing companies that the market has historically valued at lower P/E ratios.
At the end of August, the discount shrunk to 10%, a valuation level not reached anytime in the past 22 years. At these valuation levels, investors seeking higher yields might want to exercise some caution.
Buying stocks just for their higher yields could leave you disappointed with your stocks' total returns going forward. For example, if the relative valuation were to drop back to historical averages, all else being equal, a high-dividend-yield portfolio would experience close to a 20% loss relative to the market. For a portfolio yielding 5%, it could take close to four years of income to recoup this loss.
Sector valuations
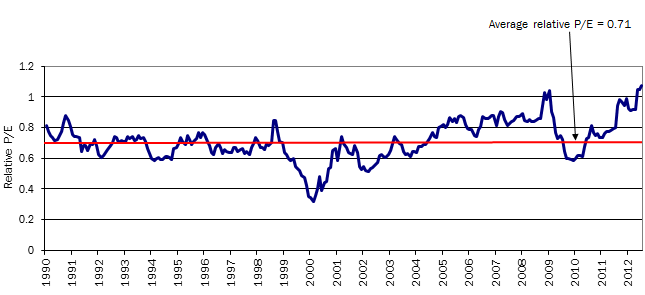
Valuation concerns could also be surfacing in several of the more-defensive sectors, such as utilities, as a result of investors seeking higher yields and lower price swings. To see the evolution of this risk, we calculated the monthly median P/E for the stocks in each of the 10 sectors from January 1990 to July 2012. We then compared the median P/E for the utilities sector to that of the market (defined again as the top 1,500 stocks ranked by market cap).
As the chart below shows, the utilities sector normally trades at a 20–40% valuation discount to the market—not surprising given the sector's slower-growth companies. Recently, though, investors have been willing to pay relatively more for the higher yields and relatively lower price variability historically associated with utility stocks.
Utility Sector P/E Divided By Larger Market P/E

Source: Schwab Center for Financial Research, data from January 31, 1990 through July 31, 2012. Larger market defined as top 1,500 stocks by market capitalization.
Utility stocks, in aggregate, are currently not only trading at a median P/E greater than the market, but at the highest relative valuation level in the past 22 years. During that time, utilities traded at premium valuation to the market only one other time—the start of the economic crisis in late 2008 and early 2009.
Although this historically high valuation level can continue for a while, the increased chance of underperforming going forward should give pause. All else being equal the valuation may fall back to its historical average and we think utility stocks could lose a third of their value to the market.
Lower volatility valuations
A final area of potential concern is the current high valuation of low-beta stocks—those with lower price variability relative to the market.
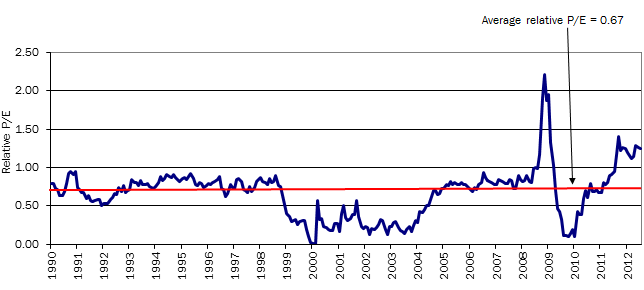
In the chart below, we show the median P/E of low-beta stocks relative to the median P/E for the highest-beta stocks. Using the same group of 1,500 stocks, we defined the lowest-beta stocks as the 20% with the lowest beta, and the highest-beta stocks as the 20% with the highest beta.
Low-Beta P/E Divided by High-Beta P/E

Source: Schwab Center for Financial Research, data from January 31, 1990 through July 31, 2012. Top 1,500 stocks by market capitalization.
Our research indicates that since 1990, low-beta stocks have usually traded at a P/E 30-40% lower than higher-beta stocks because they were associated with slower-growing firms that the market has valued at lower P/E ratios.
Currently, low-beta stocks are trading at a P/E 25% greater than the high-beta P/E! Again, the only time we saw higher valuations for low-beta stocks was during the recent economic crisis. It was right after this period that the market bottomed and low-beta stocks underperformed their higher-beta brethren.
At these valuation levels, investors appear to be paying up for low-beta stocks with little regard for the potentially higher earnings growth opportunities historically associated with higher-beta stocks. Should relative valuations fall back to historical averages, low-beta stocks could lose close to half their value relative to high-beta stocks.
Managing the valuation risks
Collectively, investors appear to have pushed valuations levels of "safe" high-yield and low-beta stocks to high levels that are unprecedented, positioning their portfolios for possible future disappointment. However, knowing which valuations are cause for concern should help you better navigate these risks.
Here are some guidelines on how you might be able to better manage these risks:
- Pay attention to the valuations you're paying for any investment—valuations at the high end of a stock's historical range could be a warning sign.
- Be aware of your sector allocations; try not to overweight sectors where valuations may be stretched. Many stocks with higher dividends or lower price variability can be found in more-defensive sectors, which tend to be overrepresented in some low-volatility exchange-traded funds.
- If you still want to own more-defensive-type stocks, try to favor those with higher-quality financial statements and more reasonable valuations. Clients can find some of them using our online stock screener and screening for A and B rated stocks with higher yields and lower beta.
- Take a contrarian approach and consider investing in more-cyclical stocks that have higher beta. Again using the screener, you can screen for A and B stocks with betas greater than one.
Important Disclosures
Schwab Equity Ratings use a scale of A, B, C, D and F, and are assigned to approximately 3,200 US-traded stocks headquartered in the United States and certain foreign nations where companies typically locate or incorporate for operational or tax reasons. Schwab's research outlook is that A-rated stocks, on average, will strongly outperform, and F-rated stocks, on average, will strongly underperform the equities market during the next 12 months. Schwab Equity Ratings are not personal recommendations for any particular investor. Before buying, investors should consider whether the investment is suitable for themselves and their portfolio. Schwab Equity Ratings should only constitute one component in your own research to evaluate stocks and investment opportunities. From time to time, Schwab may update the Schwab Equity Ratings methodology.
The information provided is for general informational purposes only and should not be considered as an individualized recommendation or personalized investment advice. The investment strategies mentioned here may not be suitable for everyone. Each investor needs to review an investment strategy for his or her own particular situation before making any investment decision.
All expressions of opinion are subject to change without notice in reaction to shifting market conditions. Examples provided are for illustrative purposes only and not intended to be reflective of results you can expect to achieve.
Data contained here is obtained from what are considered reliable sources; however, its accuracy, completeness or reliability cannot be guaranteed.
Past performance is no guarantee of future results.
The Schwab Center for Financial Research is a division of Charles Schwab and Co., Inc.
Thumbs up / down votes are submitted voluntarily by readers and are not meant to suggest the future performance or suitability of any account type, product or service for any particular reader and may not be representative of the experience of other readers. When displayed, thumbs up / down vote counts represent whether people found the content helpful or not helpful and are not intended as a testimonial. Any written feedback or comments collected on this page will not be published. Charles Schwab & Co. may in its sole discretion re-set the vote count to zero or remove the modules used to collect feedback and votes.
Copyright © Schwab Center for Financial Research


