by Don Vialoux, Tech Talk, EquityClock.com
Upcoming US Events for Today:
- Weekly Jobless Claims will be released at 8:30am. The market expects Initial Claims to show 372K versus 388K previous. Continuing Claims will be released at 3237K versus 3252K previous.
- Durable Orders for September will be released at 8:30am. The market expects a month-over-month gain of 7.0% versus a decline of 13.2% previous. Excluding Transportation, the expectation is a gain of 1.0% versus a decline of 1.6% previous.
- Pending Home Sales for September will be released at 10:00am. The market expects a month-over month increase of 2.5% versus a decline of 2.6% previous.
- Kansas City Fed Manufacturing Index for October will be released at 11:00am. The market expects 4 versus 2 previous.
Upcoming International Events for Today:
- Great Britain Gross Domestic Product for the Third Quarter will be released at 4:30am EST. The market expects a year-over-year decline of 0.4% versus a decline of 0.5% previous.
The Markets
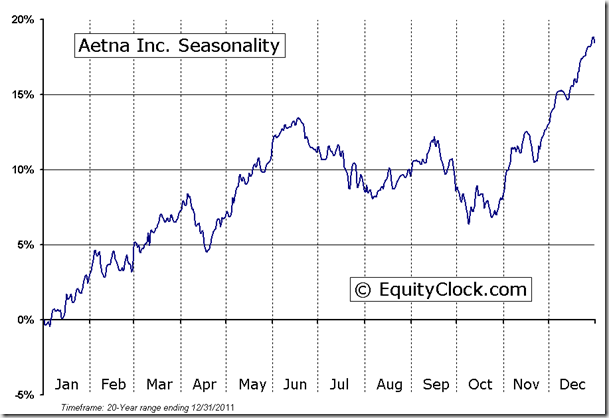
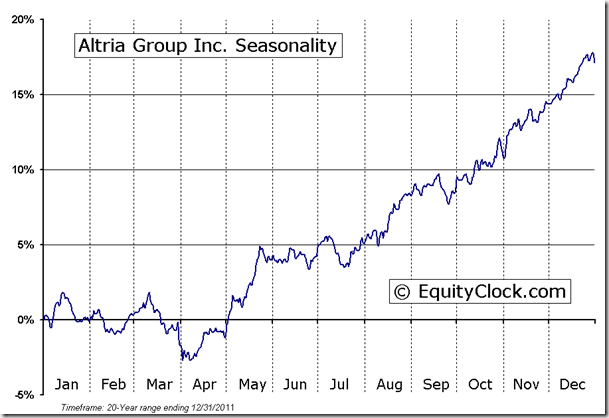
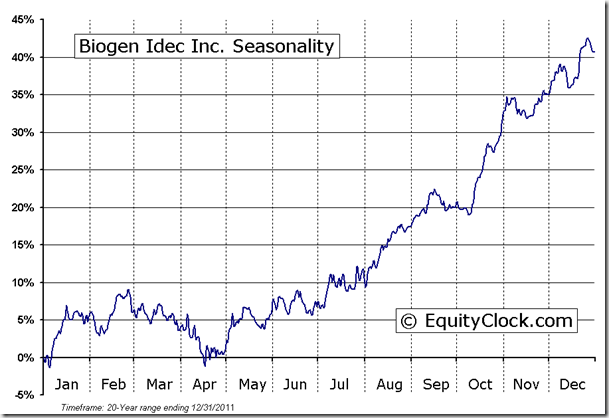
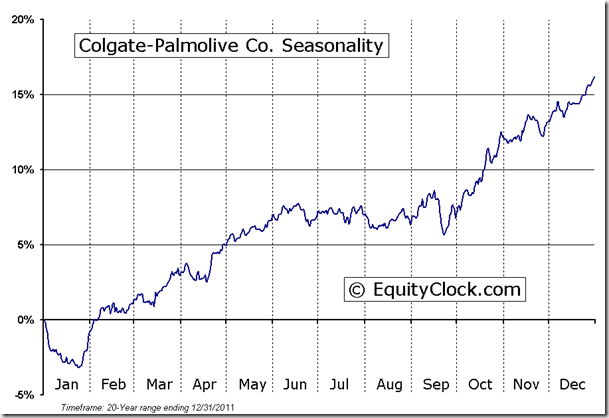
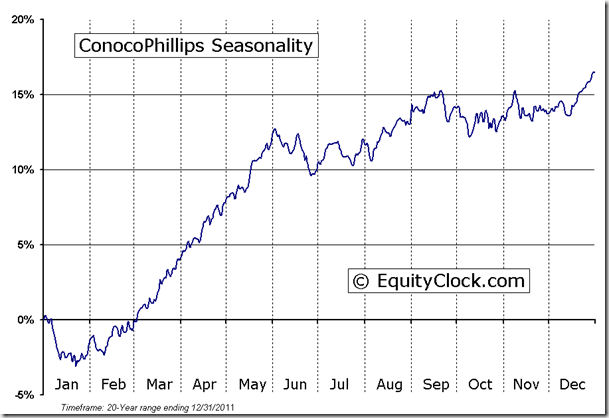
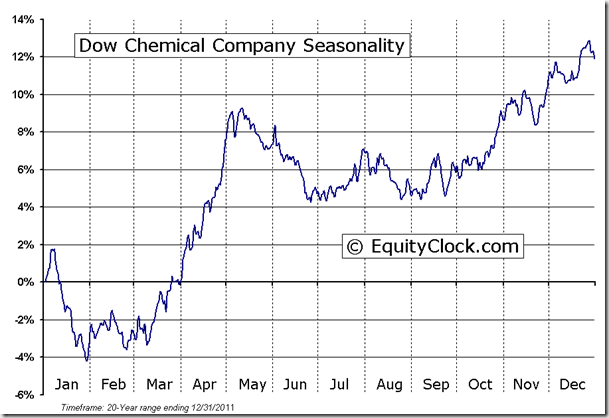
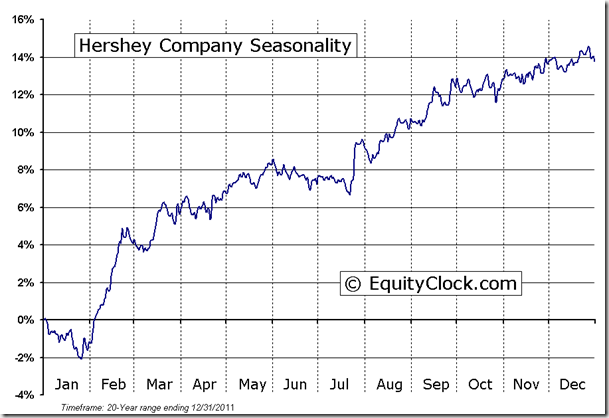
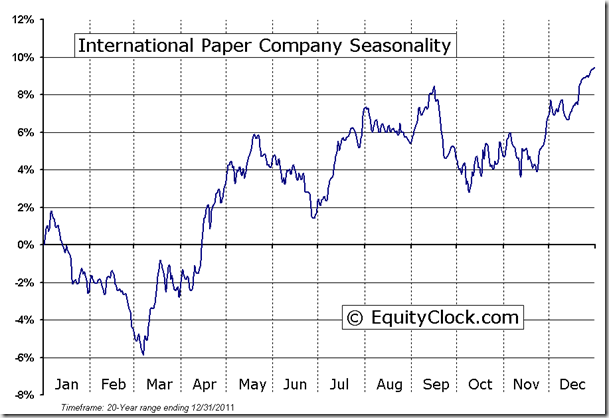
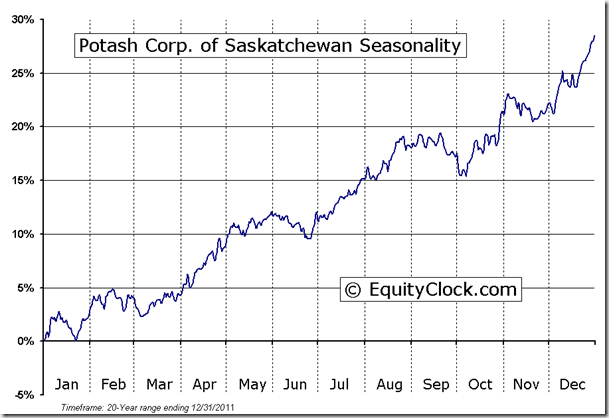
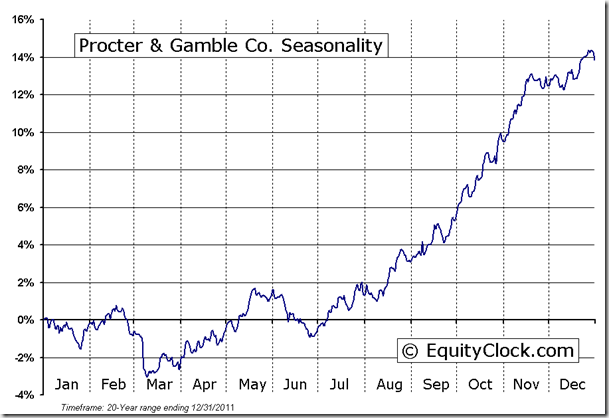
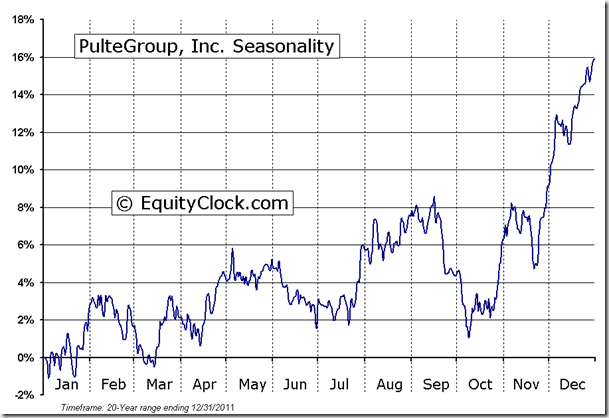
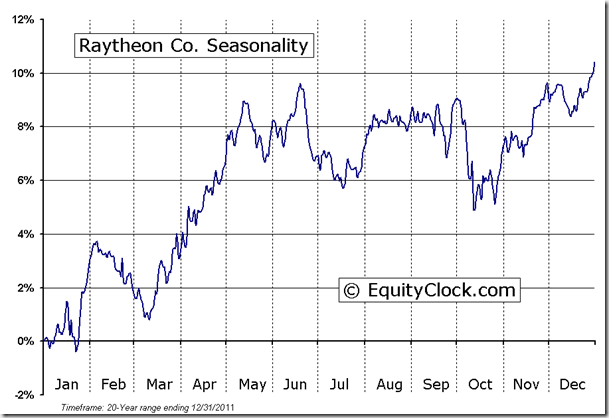
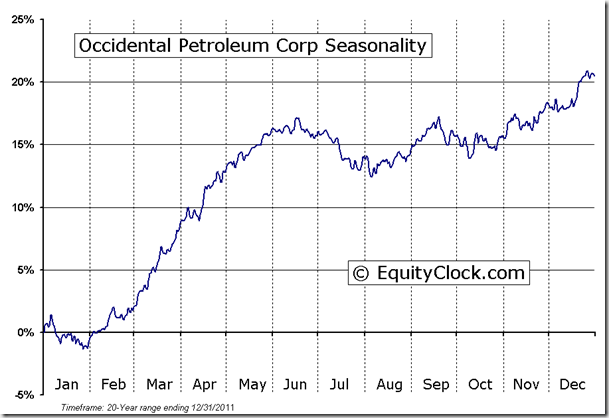
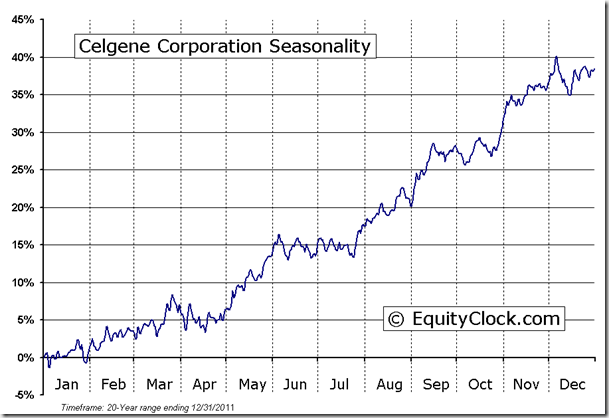
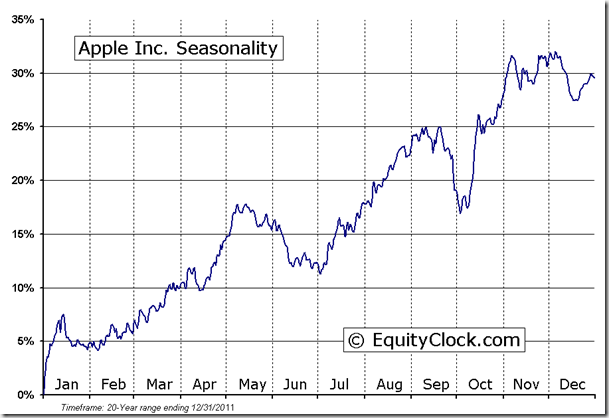
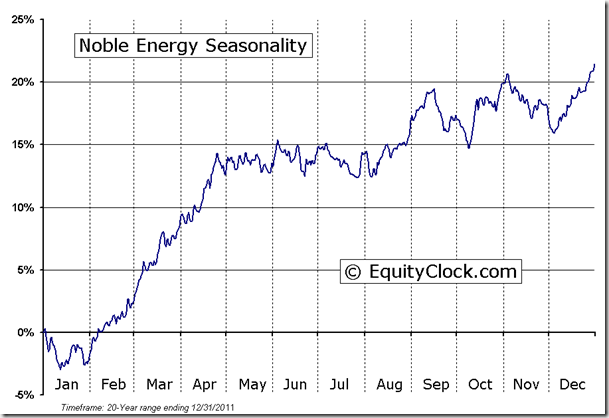
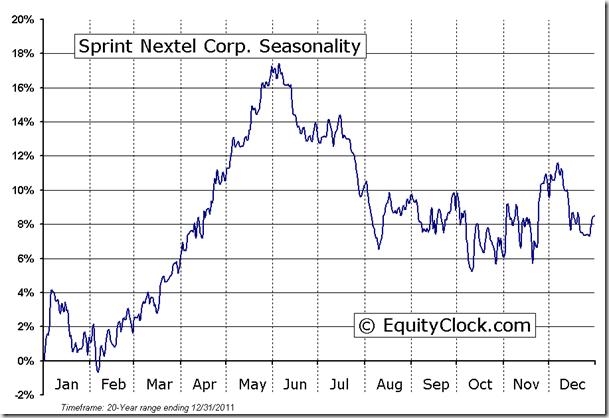
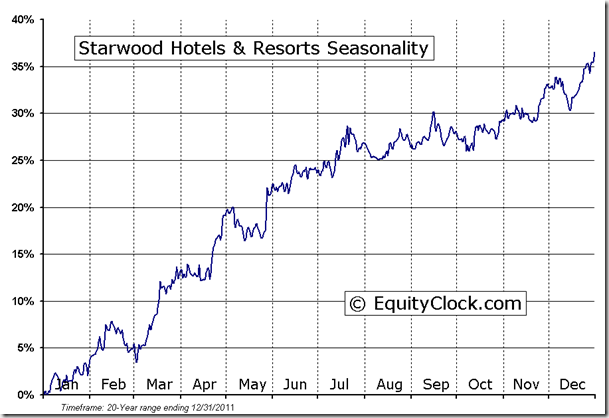
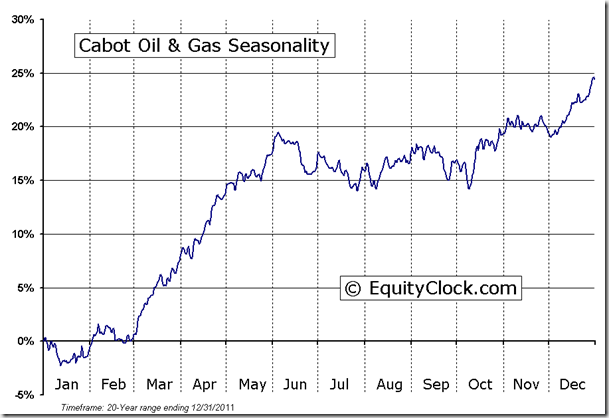
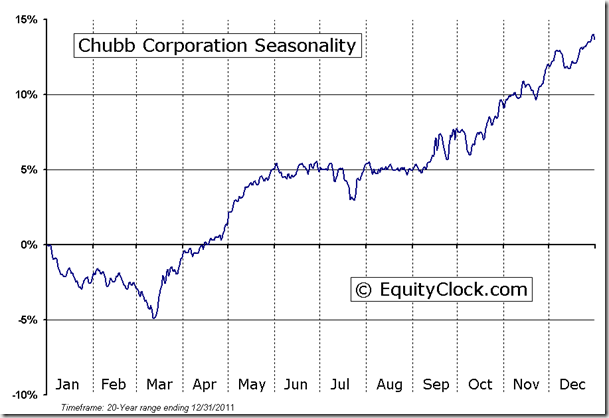
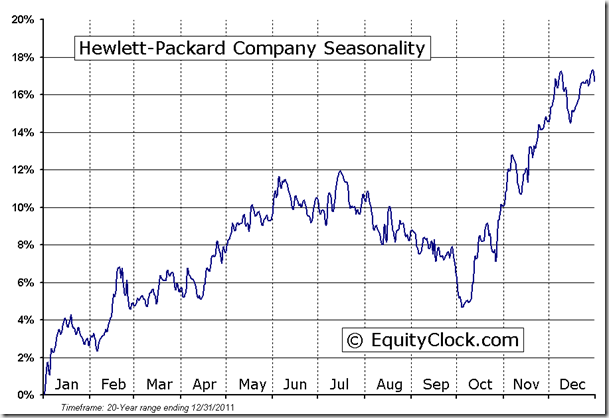
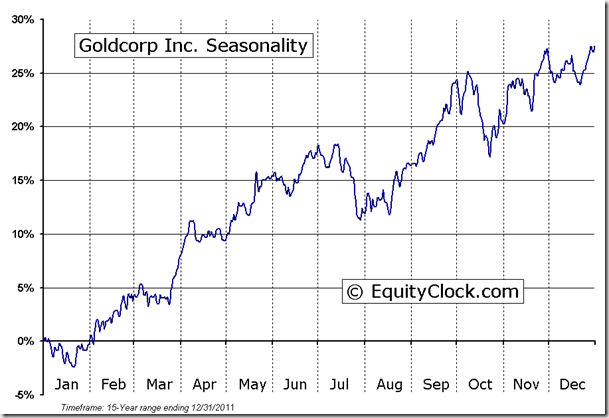
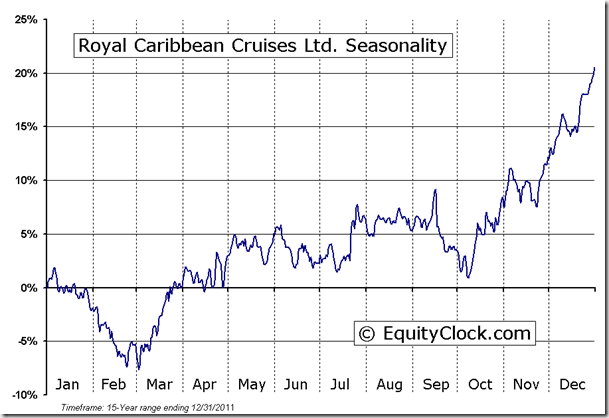
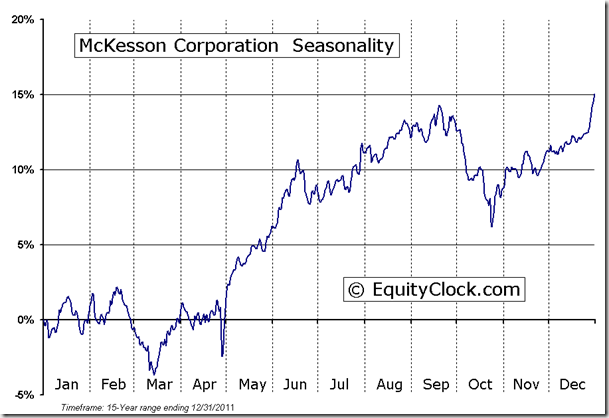
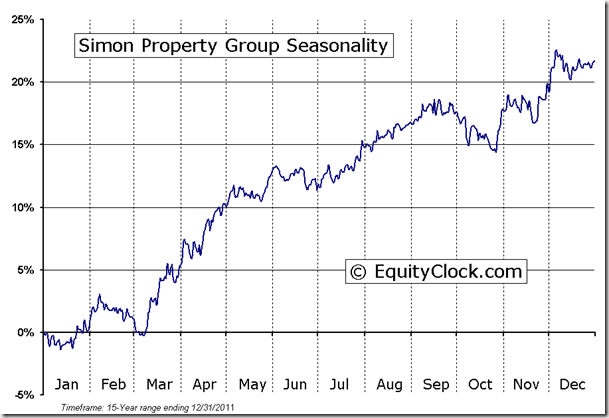
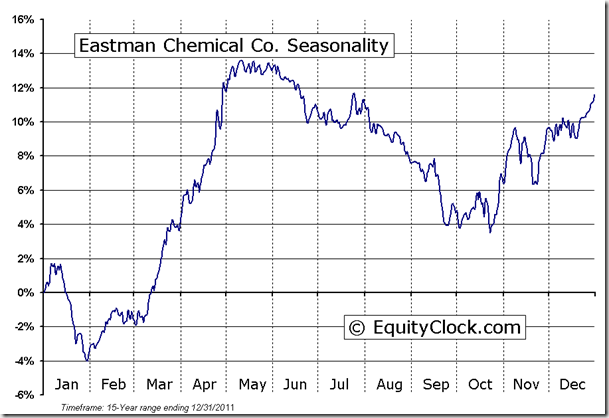
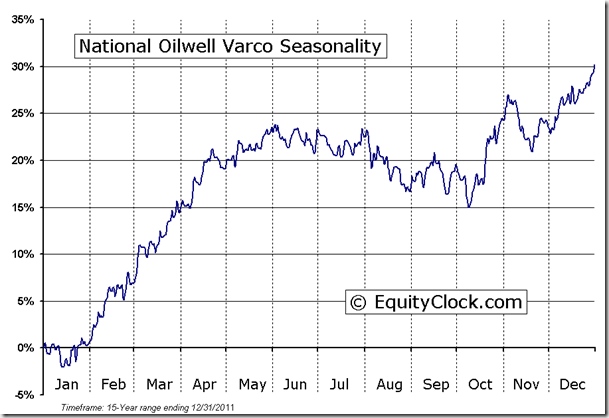
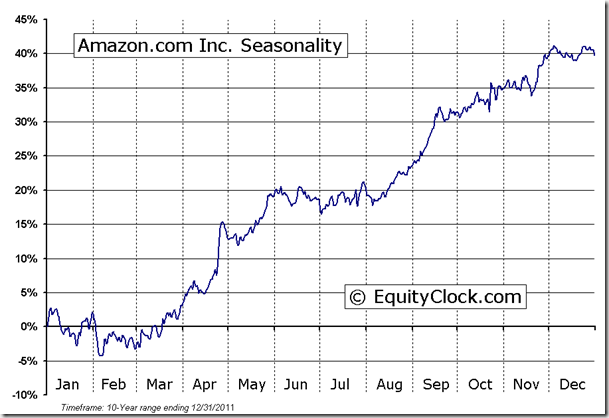
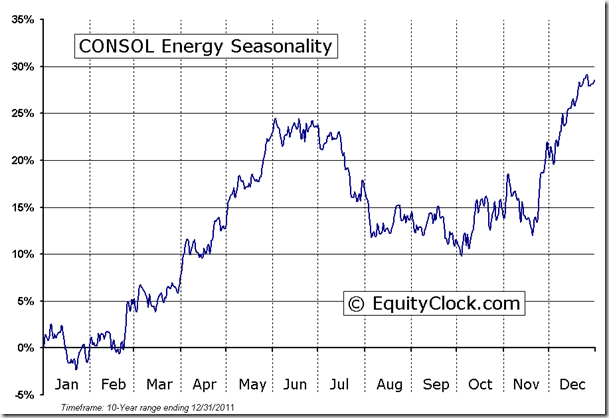
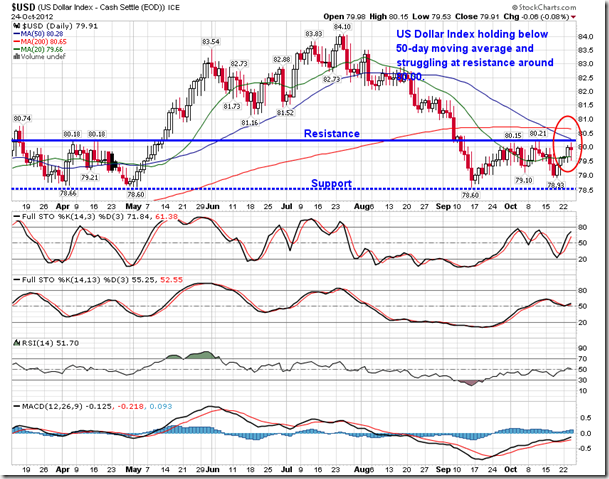
Markets struggled on Wednesday, finishing slightly in negative territory as weak PMI numbers out of Europe and continued earnings struggles have investors questioning future growth. Manufacturing and Service PMIs in Europe are indicated to have pushed further into contractionary territory for the month of October, missing estimates calling for a slight improvement over past results. PMI services in Germany, which had previously indicated expansion with a reading above 50, fell below this median line, leaving investors to doubt that the one bright spot in Europe might also be succumbing to the recessionary pressures in the region. Manufacturing seasonally picks up in November through to May, but signs of bottoming in recent European economic numbers have yet to be realized. Meanwhile, in the US, investors remained focused on earnings. The theme of the season appears to be “60-40”: 60% of companies are beating on earnings due to cost reduction initiatives and only 40% are beating on revenues as slowing growth around the world takes a bite out of top line results. The impact of the US dollar has also been cited as reason for lower revenues due to the rise in the currency that took place in July and August, creating an unfavorable exchange rate for international companies. However, the US Dollar index has declined substantially since the end of August, pushing the currency back to levels last seen in the Spring. Depreciation in the US Dollar should act as a tail-wind for revenues into the fourth quarter, typically the period when substantial revenues are generated, particularly for consumer companies. The US Dollar Index seasonally trades flat to positive in October and November, followed by negative tendencies in the month of December. Today is the busiest day of earnings season thus far with 309 companies reporting, including Aetna, Altria, Biogen, Cenovus Energy, Colgate-Palmolive, Conoco-Phillips, Dow Chemical, Goldcorp, Hershey, International Paper, Potash, Procter & Gamble, Pulte Homes, Raytheon, Royal Caribbean Cruises, Occidental Petroleum, National-Oilwell, Celgene, Amazon.com, Apple Inc, Consol Energy, McKesson, Noble Energy, Simon Property Group, Sprint, Starwood Hotels, Cabot Oil, Chubb Corp, Eastman Chemical, and Hewlett-Packard.
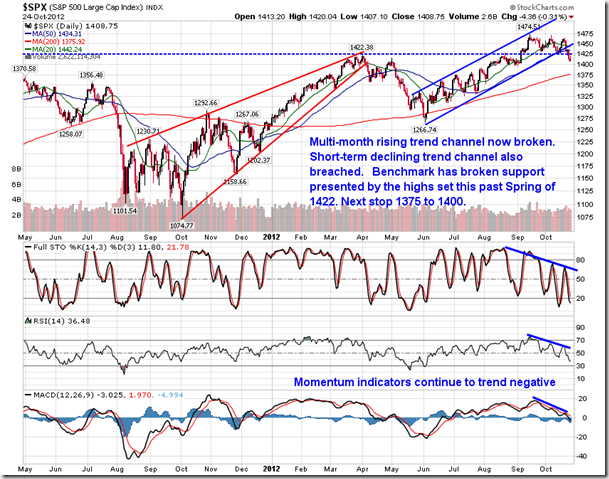
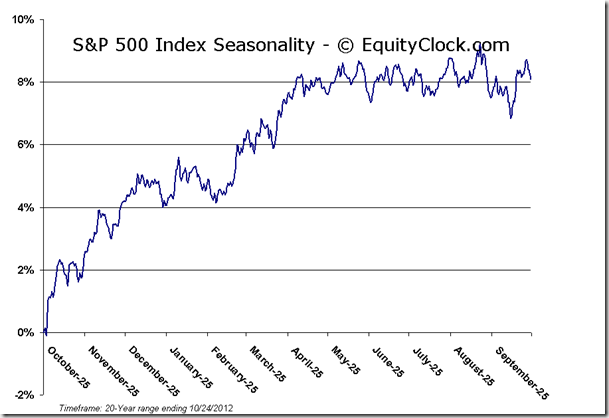
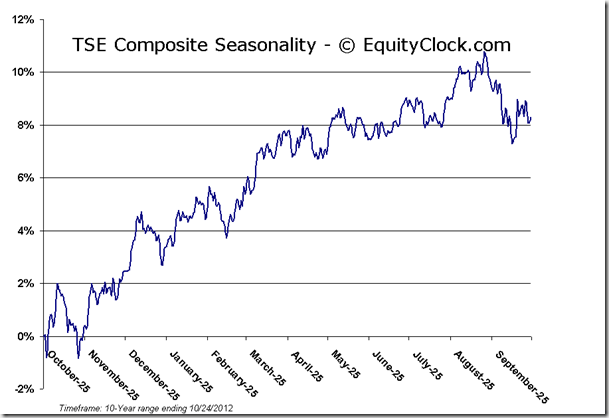
Equity markets continue to realize technical damage as the bears take control of the price action. Momentum indicators, such as RSI and MACD, continue to trend negative. Levels of support, presented by major moving averages and horizontal levels of significance, continue to be broken. Breadth continues to decline. Evidence is overwhelming that the market is rolling over and it is not a matter of how far the markets fall, but how long will the selling last. Consensus amongst analysts is that an area just above the 200-day moving average for the S&P 500 will provide the first point of support for this market. However, support under this market still remains quite plentiful, so it would be pure speculation over which point holds. The more important question is “how long will the selling last?” Generally, at this point in the third quarter earnings season, a market pullback is normal as earnings are digested. The majority of companies will have reported by the end of next week, suggesting that the earnings influenced weakness may conclude by mid to late next week, potentially kicking off the period of seasonal strength for the markets that runs from through to May. Also, the typical factor for end of October gains during the presidential election year prior to voting day may not occur. Usually investors have a good idea at this point in time, after the debates have concluded, who the president will become, introducing clarity to equity markets. However, the spread between the candidates is still extremely tight. Mitt Romney was indicated to be 1 percentage point ahead of Barack Obama according to Wednesday’s Reuters/Ipsos daily tracking poll. Uncertainty prior to the election could keep investors on the sidelines in the short-term.
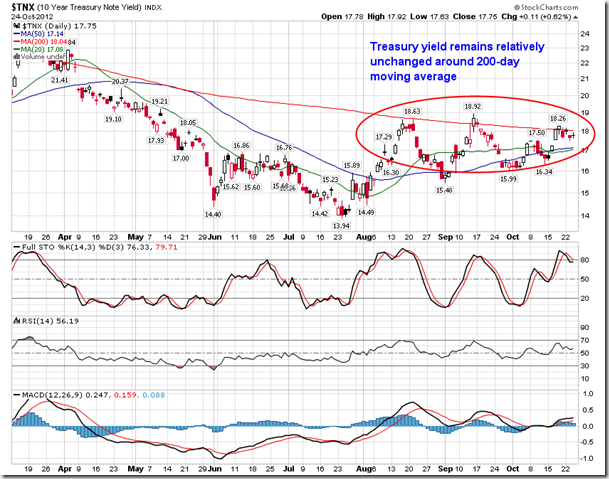
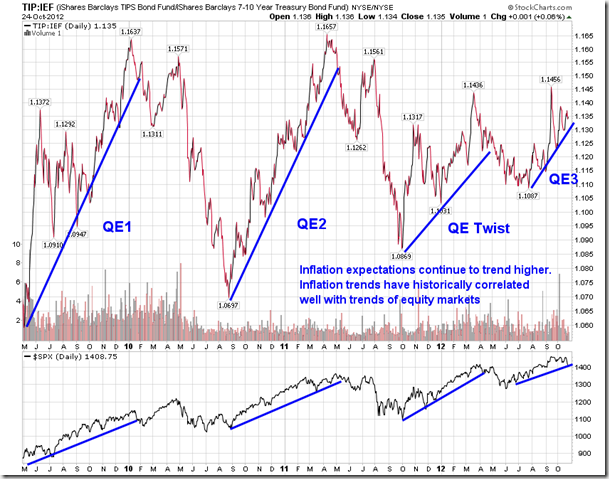
Despite ongoing equity market weakness, reason to be optimistic of future strength remains. US Treasuries, the long-used risk-off trade, have barely moved amidst significant weakness in equity markets over the past month. Yields on the 10-year note still remain around the 200-day moving average, suggesting that demand for these safe haven assets has not re-emerged to the detriment of stocks. A break of the 200-day moving average line for US treasuries could coincide with the next leg higher for equities as funds flow from bonds into stocks. As well, the US Dollar, another risk-off trade, has yet to show strength above the early October highs. The US Dollar Index continues to show signs of trending lower, trading below its 50-day moving average. A breakdown in the US Dollar Index below support at 78.60 would likely act as a bullish catalyst for risk assets, mainly stocks and commodities. Another positive for risk assets is the fact that inflation expectations continue to trend higher. Using the ratio of the TIPS Bond Fund (TIP) versus the 7 –10 year Treasury Bond Fund (IEF) as a benchmark for inflation expectations, the intermediate trend remains firmly higher from the summer lows. Stocks and commodities have historically performed well during inflationary periods, typically induced by past quantitative easing programs.
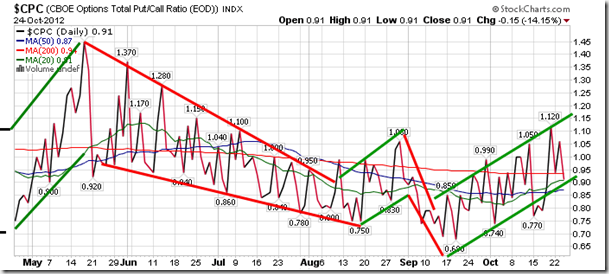
Sentiment on Wednesday, as gauged by the put-call ratio, ended bullish at 0.91.
Chart Courtesy of StockCharts.com
Chart Courtesy of StockCharts.com
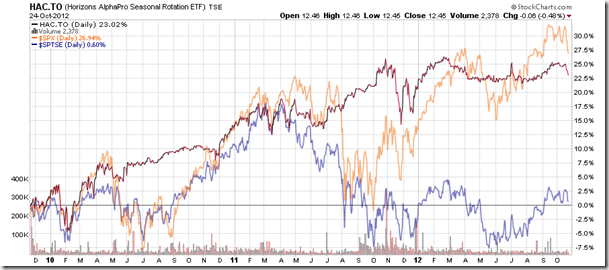
Horizons Seasonal Rotation ETF (TSX:HAC)
- Closing Market Value: $12.45 (down 0.48%)
- Closing NAV/Unit: $12.43 (down 0.42%)
Performance*
| 2012 Year-to-Date | Since Inception (Nov 19, 2009) | |
| HAC.TO | 2.07% | 24.3% |
* performance calculated on Closing NAV/Unit as provided by custodian
Click Here to learn more about the proprietary, seasonal rotation investment strategy developed by research analysts Don Vialoux, Brooke Thackray, and Jon Vialoux.


