Upcoming US Events for Today:
- Producer Price Index for September will be released at 8:30am. The market expects an increase of 0.8% versus an increase of 1.7% previous.
- Consumer Sentiment for October will be released at 9:55am. The market expects 78.3, unchanged from the previous report.
- Treasury Budget for September will be released at 2:00pm.
Upcoming International Events for Today:
- Euro-Zone Industrial Production for August will be released at 5:00am EST. The market expects a decline of 0.5% versus an increase of 0.6% previous.
The Markets
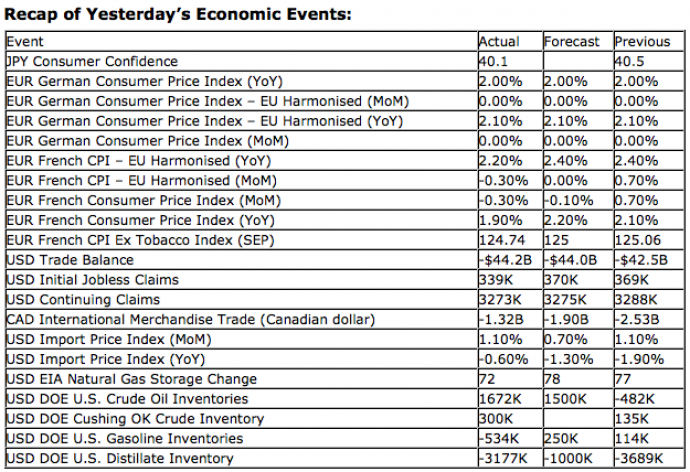
Equity markets faded early gains on Thursday as the enthusiasm surrounding upbeat employment data was dismissed as being an anomaly. Initial jobless claims were reported at the lowest level in over four years, but the result was distorted by a significant abnormal drop in claims posted by one state, leaving investors to doubt the improving employment data. Most equity benchmarks ended near the flatline as analysts wait for further economic and earnings data in the days to come.
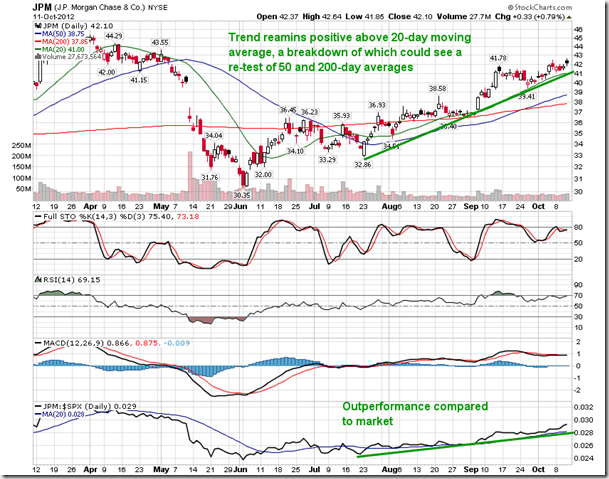
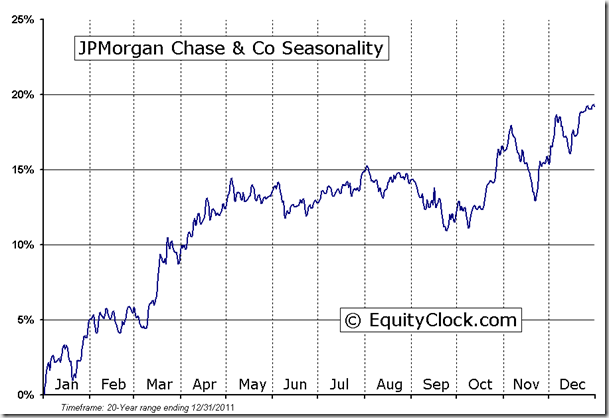
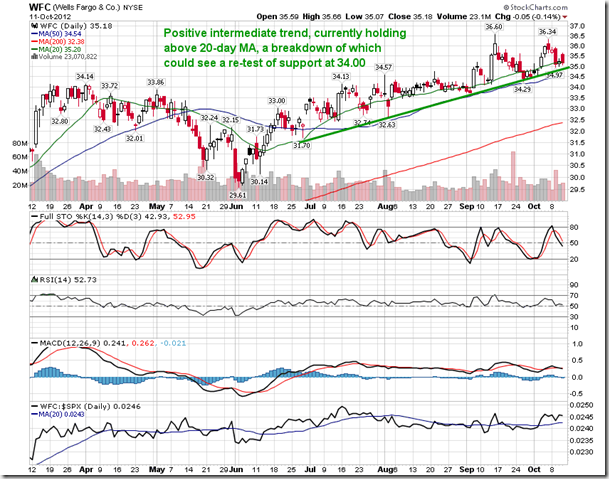
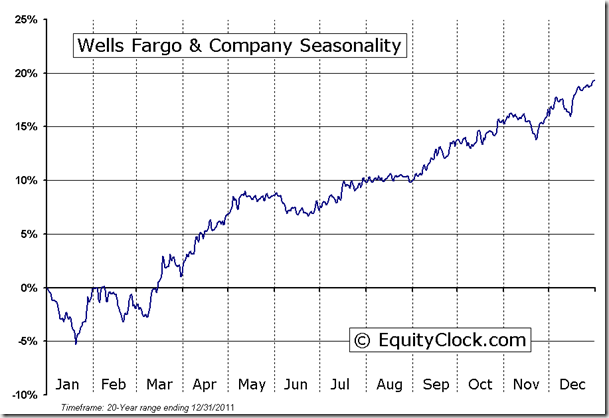
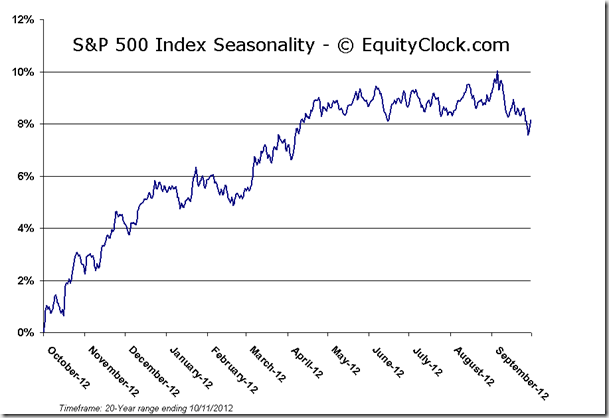
On Friday, two financial titans report earnings before the opening bell. Wells Fargo and JP Morgan are expected to report earnings growth of around 20% compared to the year ago period, bucking the contraction that is expected to be realized for the broad market as a whole. Each stock currently portrays a reasonably strong technical profile with positive trends holding above 20-day moving averages and outperformance compared to the market remaining evident over recent weeks. However, momentum indicators that are presently showing a neutral trend gives little reason to expect any significant positive drive over the intermediate term, a trend that is typical on a seasonal basis in the fourth quarter. Seasonal tendencies for the financial stocks during the fourth quarter, albeit showing a positive bias on the charts, are largely variable, gaining more from the positive influences of the broad market rather than being a driver of it. US financials find their period of seasonal strength within the first and second quarter of the year as positive outlooks for the the year lift stocks during the fist half.
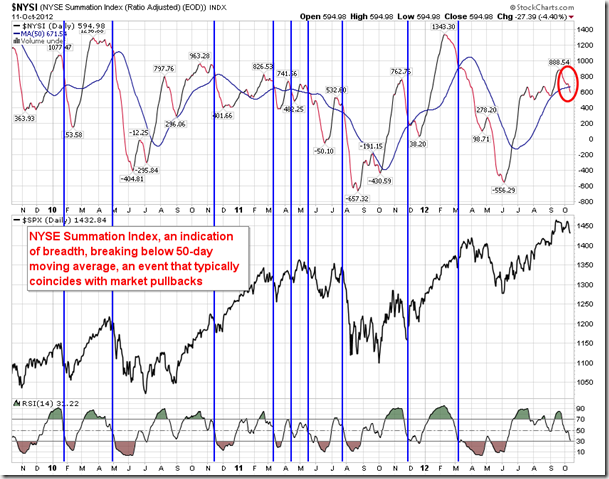
Yesterday we provided a chart of the percent of stocks trading above 200-day moving averages and how it coincided with market declines as the indicator fell below its 50-day moving average. Here is another similar indicator that has coincided well with market pullbacks over the last many years. The NYSE Summation Index, an indication of breadth, has broken below its 50-day moving average, signaling weakness within equity markets as technical indicators continue to deteriorate. As you can see from the chart below, this is more of a coincident indicator, confirming the pullback, rather than a leading indicator, anticipating one.
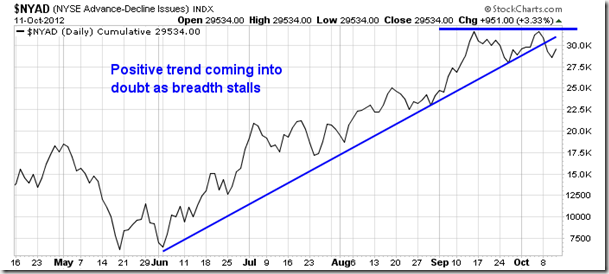
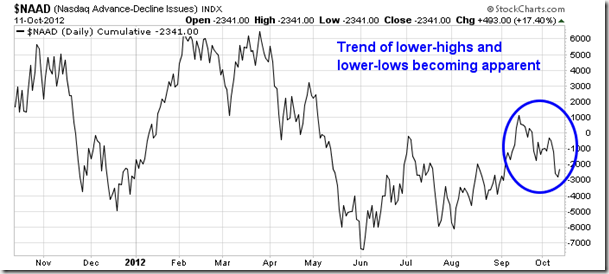
Other indicators of breadth are equally cautionary. The NYSE Advance-Decline line has seemingly stalled at its highs set in September, while the NASDAQ Advance Decline line has started to show lower-highs and lower-lows, indicative of a negative trend. Each of these breadth indicators are confirming the lack of positive momentum that has followed the unveiling of the recent quantitative easing program in the US as investors focus on the cautionary events ahead, such as earnings season and the fiscal cliff at the end of this year.
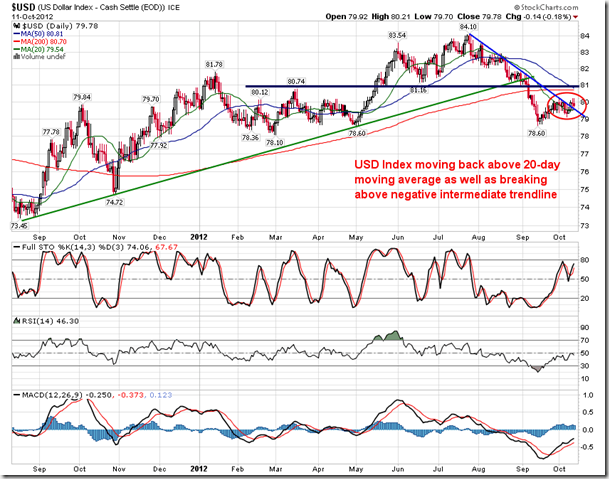
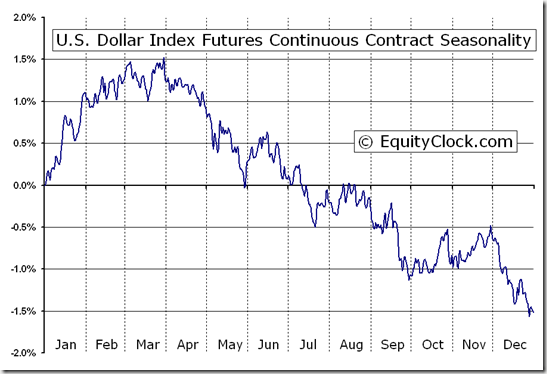
And finally, the US Dollar index has been acting as a weight on stocks and commodities as the currency resumes this counter-trend rally, pushing above its 20-day moving average for the first time since early summer. The index has also broken through the declining trendline following the two and a half month pullback. A retest of broken support at 81.00 appears likely, keeping pressure on commodities over the short-term during a period when hard assets, such as gold and oil, typically decline. Seasonal tendencies for the US Dollar index between now and mid-November are flat to positive. Negative seasonal tendencies resume during the month of December.
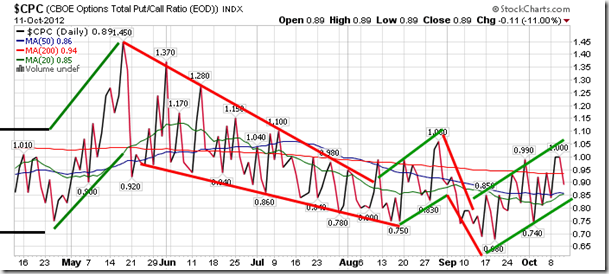
Sentiment on Thursday, as gauged by the put-call ratio, ended bullish at 0.89.
S&P 500 Index
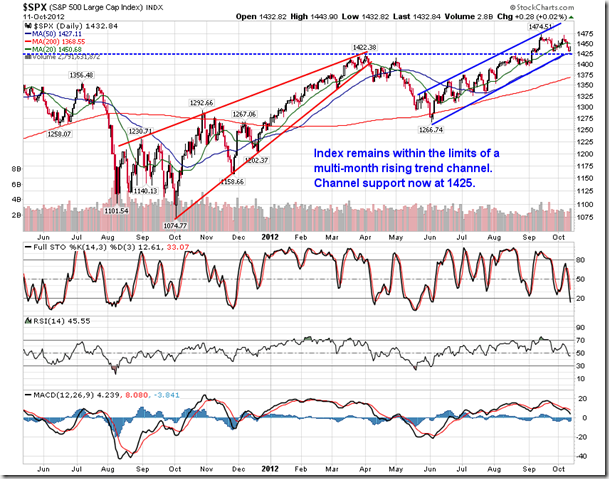
Chart Courtesy of StockCharts.com
Chart Courtesy of StockCharts.com
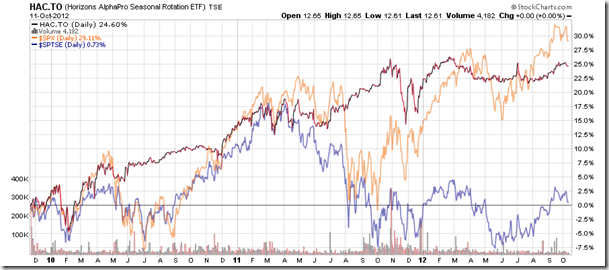
Horizons Seasonal Rotation ETF (TSX:HAC)
- Closing Market Value: $12.61 (unchanged)
- Closing NAV/Unit: $12.62 (down 0.03%)
Performance*
| 2012 Year-to-Date | Since Inception (Nov 19, 2009) | |
| HAC.TO | 3.63% | 26.2% |
* performance calculated on Closing NAV/Unit as provided by custodian
Click Here to learn more about the proprietary, seasonal rotation investment strategy developed by research analysts Don Vialoux, Brooke Thackray, and Jon Vialoux.


