by Don Vialoux, EquityClock.com
The Markets
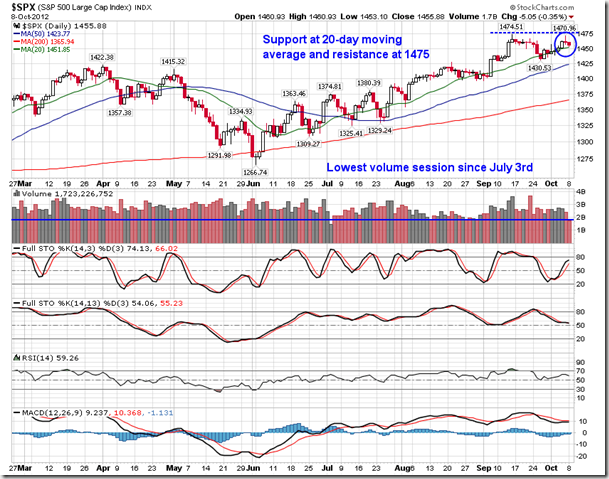
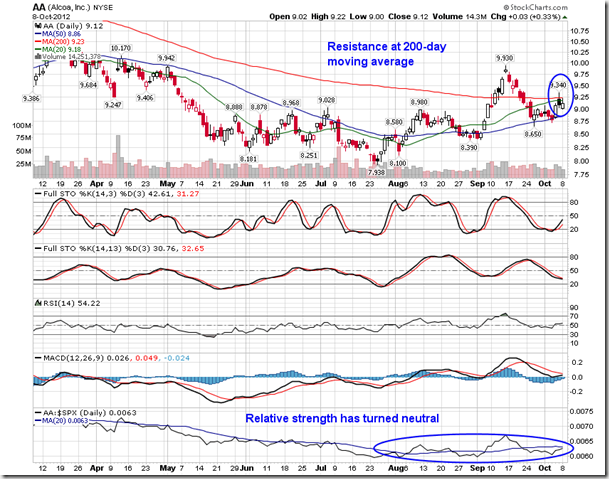
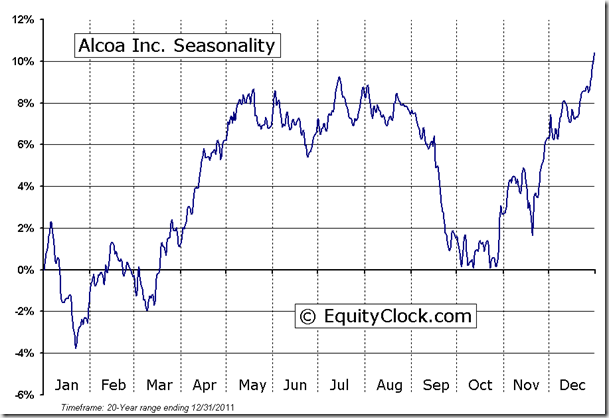
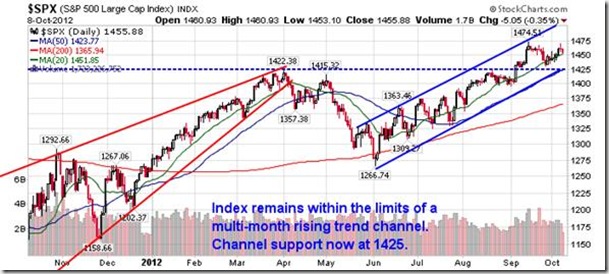
Stocks in the US traded lower on Monday in what amounted to a relatively quiet day with Columbus day in the US and the Thanksgiving holiday in Canada. Volume for the S&P 500 was the lowest since July 3rd when markets closed early for the Independence day holiday. Support remains apparent at the 20-day moving average as investors await for earnings season to begin on Tuesday after the closing bell. Alcoa will kick off the period and analysts are expecting that earnings will be nil (0), down from the 15 cents per share reported in the year ago period. Alcoa is currently resisting off of its 200-day moving average ahead of the report, a significant level to overcome in order to continue the recent positive trend for the stock. Positive seasonal tendencies for Alcoa are set to begin at the end of this month, well after the quarterly report is released.
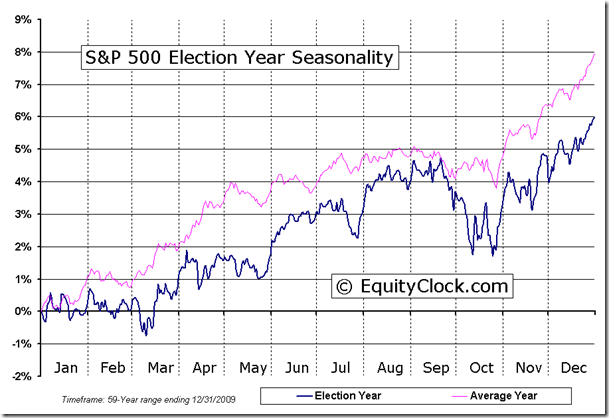
Today marks a key date within our seasonal models. October 9th, on average over the past 20-years, has marked the end of the weakest three week period of the year as earnings warning season drags on equity price action. Earnings warnings were certainly prevalent this year. Of the 103 companies of the S&P 500 that provided EPS commentary, 80 of them issues negative guidance, or just under 80%, amounting to the worst warnings season in 11 years. From peak to trough, the S&P 500 and TSE Composite saw declines of around 3% over the past three weeks, ending the period closer to the flatline as markets attempt to overcome resistance at 1475 on the S&P 500 and 12,500 for the TSE Composite. Between now and the end of October, volatility is typical as investors digest earnings and allocate portfolios prior to the end of the year. Seasonal trends for many sectors and indices turn definitively higher after October 28th with consumer stocks tending to lead the way during this holiday spending influenced period. Average return for the S&P 500 from October 9th to the end of the year is 5.82%, while election years return a slightly less 4.2%.
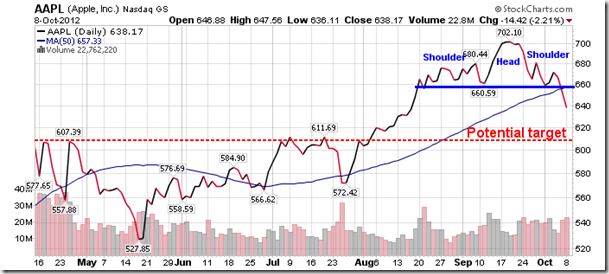
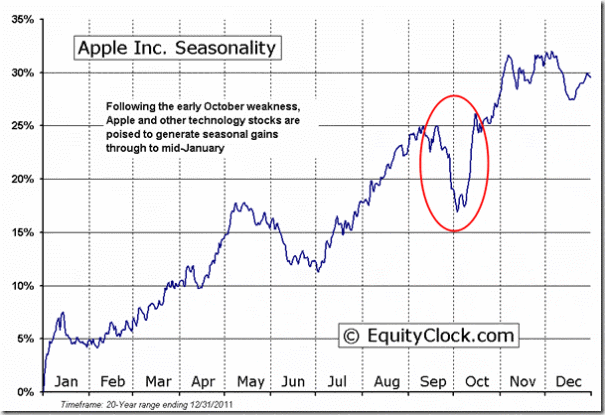
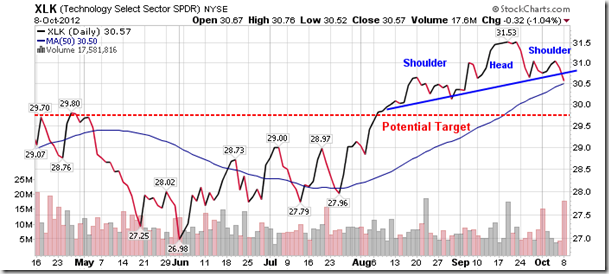
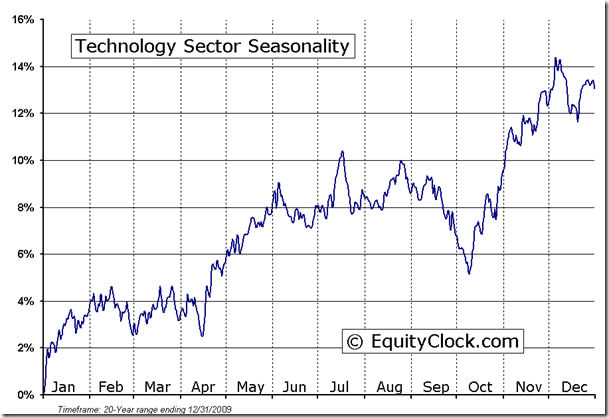
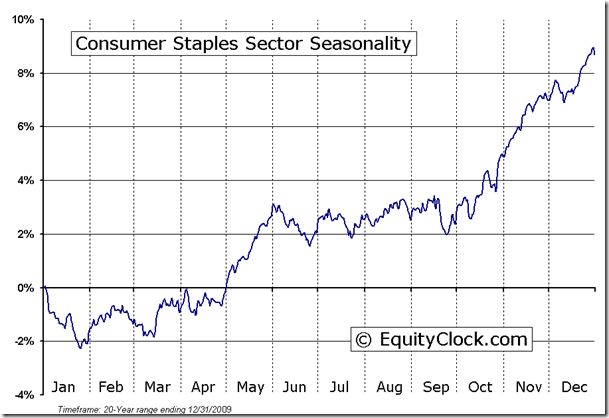
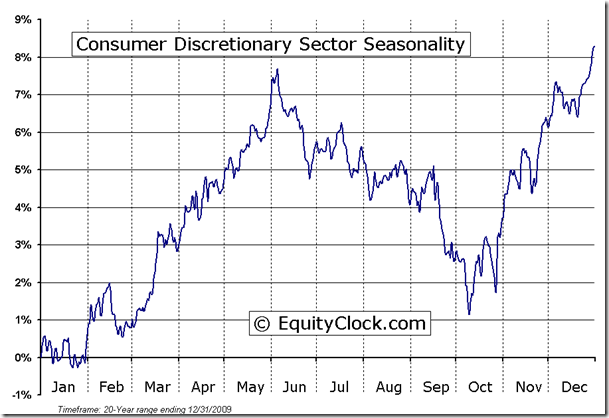
With the October 9th date now upon us, which sectors tend to do the best between now and the end of the year? The last quarter is typically all about the consumer as holiday spending drives stocks related to the season higher. This means that Consumer Discretionary, Consumer Staples, and Technology are all poised to benefit from positive seasonal influences. Seasonal tendencies for Technology turn positive on October 9th, on average, meaning that investors should now be looking for signals to buy. On the charts, negative profiles for technology companies are presently acting as a burden. Of course apple broke below its 50-day moving average on Monday and a head-and-shoulders topping pattern is apparent. Downside target for Apple is to $620 as it concludes its typical period of seasonal weakness prior to its earnings report. As Apple weighs on the sector, the Technology ETF is showing a similar head-and-shoulders topping pattern with targets of approximately 3% lower than Monday’s closing values. Short-term weakness is likely to provide ideal entry points for this seasonal trade, which typically tops out into January and February.
I will be on BNN this evening at 4:50pm to discuss the above topics as well as the outlook for the market for the intermediate-term. Tune in!
Copyright © EquityClock.com


![clip_image002[6] clip_image002[6]](https://advisoranalyst.com/wp-content/uploads/HLIC/31260e379498308757ced7d16406c625.jpg)
