by Don Vialoux, EquityClock.com
Upcoming US Events for Today:
- Motor Vehicle Sales for September will be released throughout the day.
Upcoming International Events for Today:
- The Reserve Bank of Australia Rate Decision will be released at 12:30am EST. The market expects a decline to 3.25% from 3.50% previous.
- Euro-Zone Producer Price Index for August will be released at 5:00am EST. The market expects a year-over-year gain of 2.5% versus 1.8% previous.
- China Non-Manufacturing PMI for September will be released at 9:00pm EST.
The Markets
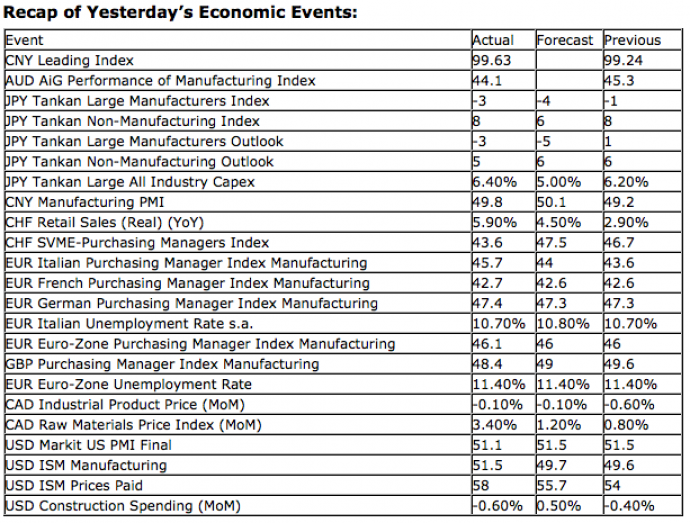
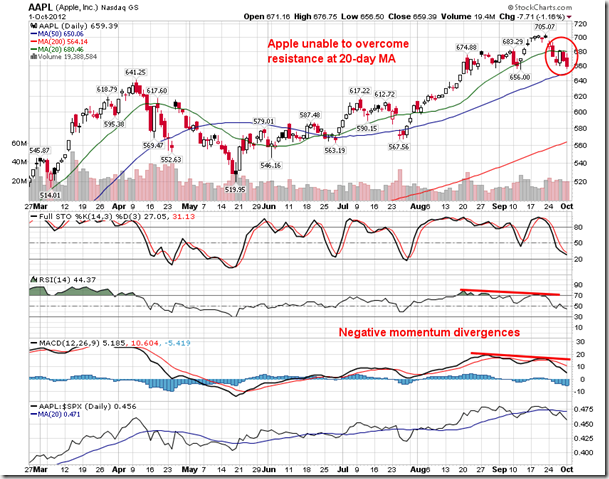
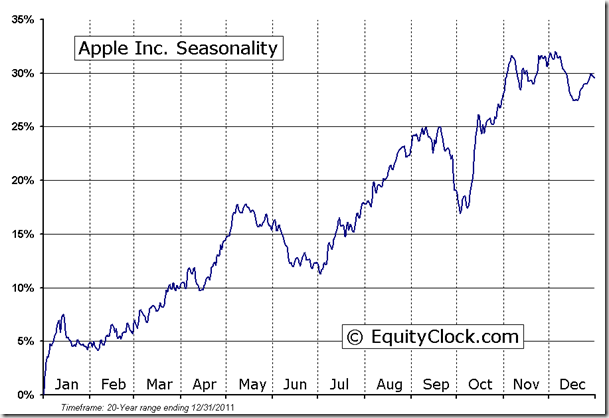
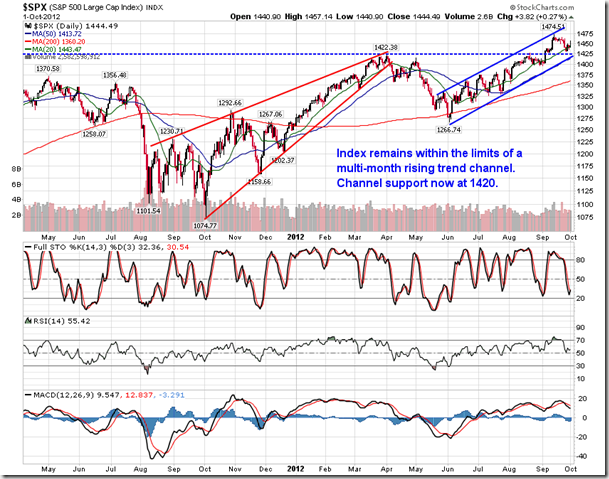
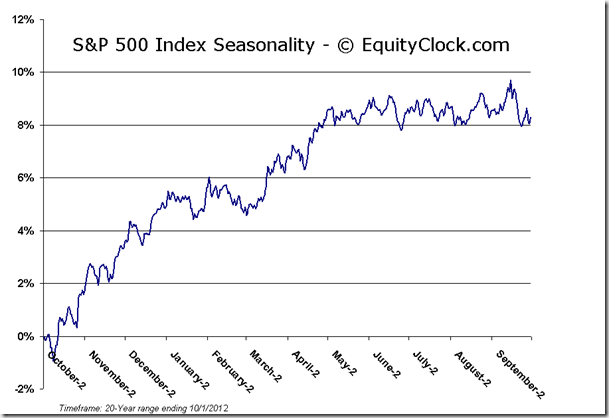
Markets opened the start of the fourth quarter with a sense of euphoria as equities surged within the first few hours of trade following better than expected economic data pertaining to manufacturing. The ISM Manufacturing Index for September recorded a surprising uptick to 51.5, above analysts estimates of 49.7. Levels above 50 indicate expansion, a characteristic that has not been prevalent in recent manufacturing reports. The strength within equities was rather short-lived, however, as Ben Bernanke spoke on the merits of current monetary policy. The Dow and S&P 500 ended marginally higher while the Tech heavy Nasdaq ended marginally lower as shares of Apple continue to show signs of profit-taking. Apple has struggled at its 20-day moving average for the past few days and momentum indicators are trending lower, hinting of further declines to comes. The period of seasonal strength for Apple, and the Technology sector in general, begins within a week or two from the start of October. Apple holds the largest individual security weight within the S&P 500, so weakness in this stock has a reasonable probability of hindering positive results in this large cap benchmark.
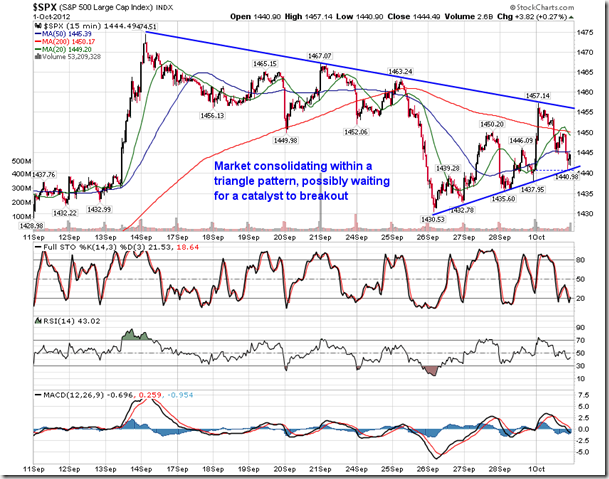
Looking at a 15 minute chart of the S&P 500 for the past two and a half weeks, a triangle pattern can be derived, which Monday’s trading activity respected precisely. Trendline resistance is presently just above 1455 while support falls just above 1440. A break beyond either level will likely provide confirmation of a bullish or bearish path as we progress further into October.
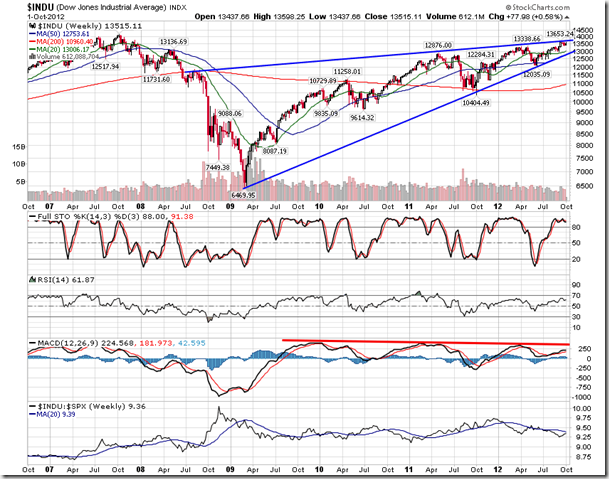
On a longer-term scale, a more ominous pattern is reaching a peak. A weekly chart of the Dow Jones Industrial Average over the past few years shows a massive rising wedge formation, which has severe bearish implications should the price action break below the lower limit of this pattern. Given the easy money policy in the US and other parts of the world, a certain amount of skepticism of the bearish implications is warranted. However, the merit of this pattern is supported by a negative momentum divergence over the same period. As the market was charting a series of higher-highs from the March 2009 bottom, MACD has shown consecutive lower significant highs, failing to confirm the positive price action. Rallies are not generating the momentum that was seen one, two, or three years ago as doubt keeps investors to the sidelines. Certainty of economic fundamentals remains culprit, a scenario that seemingly has no immediate end in sight with issues such as the fiscal cliff, presidential election, and weakening growth failing to provide future clarity. The pattern is interesting to observe, but may not warrant altering intermediate-term trade decisions until a definitive breakdown is realized.
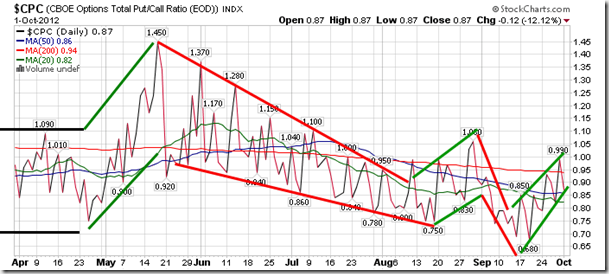
Sentiment on Monday, according to the put-call ratio, was bullish at 0.87.
Chart Courtesy of StockCharts.com
Chart Courtesy of StockCharts.com
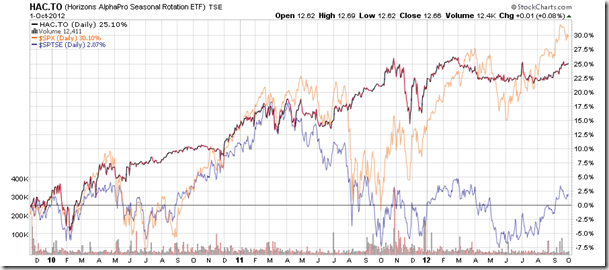
Horizons Seasonal Rotation ETF (TSX:HAC)
- Closing Market Value: $12.66 (up 0.08%)
- Closing NAV/Unit: $12.67 (up 0.12%)
Performance*
| 2012 Year-to-Date | Since Inception (Nov 19, 2009) | |
| HAC.TO | 4.03% | 26.7% |
* performance calculated on Closing NAV/Unit as provided by custodian
Click Here to learn more about the proprietary, seasonal rotation investment strategy developed by research analysts Don Vialoux, Brooke Thackray, and Jon Vialoux.
Copyright © EquityClock.com


