(Editor’s Note: Don Vialoux is scheduled to appear on BNN Television’s Market Call Tonight at 6:00 PM EDT)
Interesting Charts
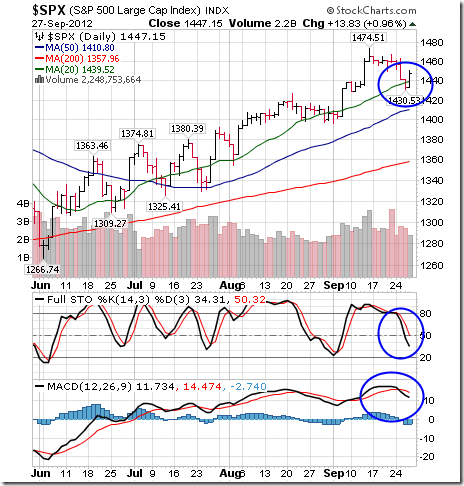
The S&P 500 Index recorded surprising strength yesterday mainly on unconfirmed news that the Chinese central bank recently pumped up to $70 billion into the Chinese economy. The rumor has merit. Historically, the Chinese economy virtually “falls off a cliff” during China’s “Golden week”, a holiday similar to our Christmas season. China’s “Golden Week” is next week. Once again, the Chinese central bank moved in anticipation of “Golden Week”.
The other positive event yesterday was announcement of Spain’s budget. Equity markets responded initially to rumors that the budget was more austere than expected. However, equity markets retreated in late trading when a more rational analysis was made.
On the charts, the S&P 500 Index managed to recover to above its 20 day moving average. However, momentum indicators continue to trend down.
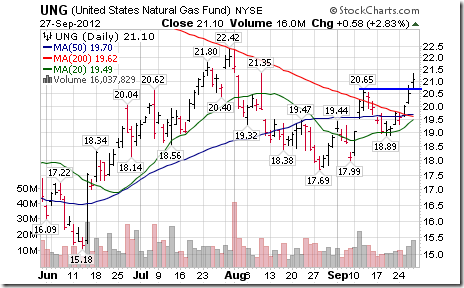
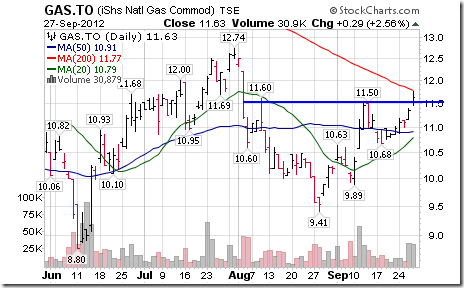
Natural gas prices have recorded an interesting breakout recently.
Updates on Seasonal Trades Recommended Since July
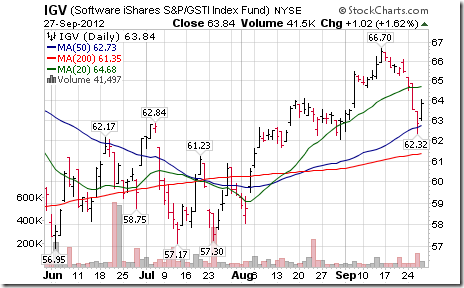
July 2: Accumulate the Software sector
Period of seasonal strength: early July to end of September
ETF: IGV at $62.18. Current price:$63.84
Comment: Selected technicals remain positive: Intermediate uptrend intact, bounced from near its 50 day moving average. Short term momentum indicators are trending down and strength relative to the S&P 500 turned negative last week. The period of seasonal strength is approaching an end. Preferred strategy is sell into strength.
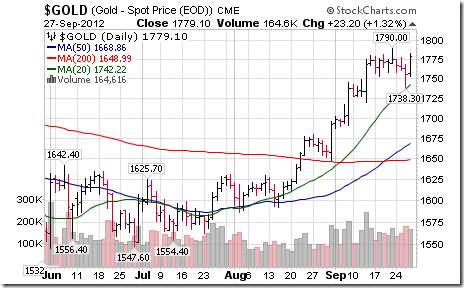
July 6: Accumulate gold bullion
Period of seasonal strength: July12th to October 9th
Gold price: $1,578.90. Current price: $1,779.10
Comment: Technicals remain positive. Intermediate trend is up. Nice bounce from near its 20 day moving average. Strength relative to the S&P 500 Index remains positive. However, momentum indicators are peaking. Hold for now, but prepare to take profits (particularly on a break below $1,738.30. Possible stop is its 20 day moving average. Gold’s weakest month in the year is the month of October.
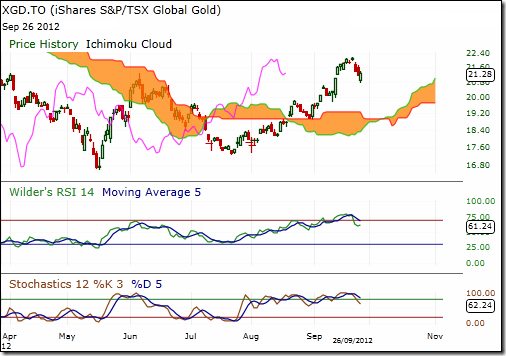
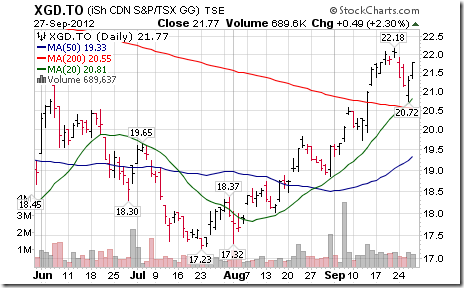
July 13: Accumulate Canadian gold equities
Period of seasonal strength: July 27th to September 25th
ETF: XGD at $18.01. Current price: $21.77
Comment: Great trade. Favourable seasonal period has ended. Short term momentum indicators have rolled over. Weakest month of the year for gold equities is the month of October. Take seasonal profits on strength.
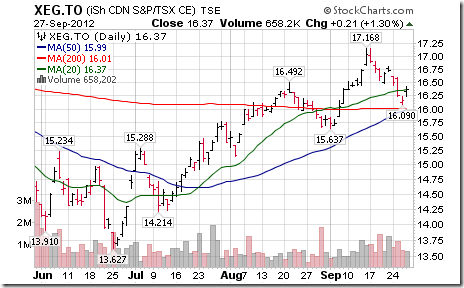
July 13: Accumulate the Canadian Energy Sector
Period of seasonal strength: July 24th to October 3rd
ETF: XEG at $15.12. Current price: $16.37
Comment: Technicals have begun to deteriorate as the end of the period of seasonal strength approaches. Short term momentum indicators are trending down. Strength relative to the TSX Composite turned negative last week.
Comment: Take profits on strength.
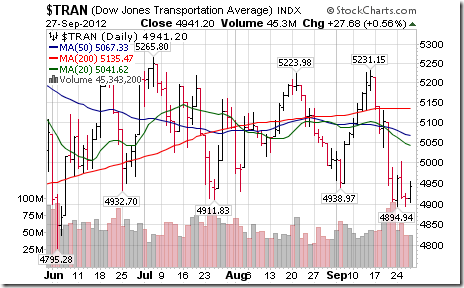
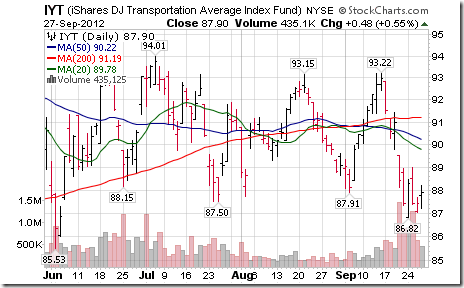
July 27: Sell the Transportation Sector
Dow Jones Transportation Average at 5,126.65. Current price:4,941.20
ETF: IYT at $91.56. Current price: $87.90
Period of seasonal weakness: August 1st to October 9th
Comment: Technicals remain negative. Intermediate trend is down. Trades below its 20, 50 and 200 day moving averages. Short term momentum indicators are trending down. Strength relative to the S&P 500 Index remains negative. Continue to sell/avoid/hold short.
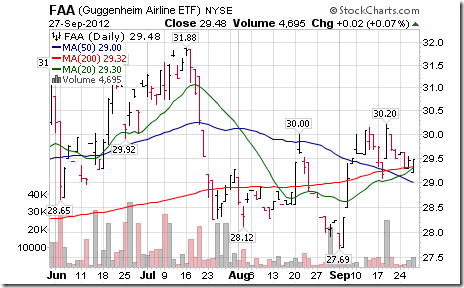
August 6th Sell the Airline sector
ETF: FAA at $28.66. Current price: $29.48.
Period of seasonal weakness: August 1st to October 9th
Comment: Technicals remain neutral/negative. Intermediate trend is neutral. Trades back and forth through its 20, 50 and 200 day moving averages. Short term momentum are trending down. Strength relative to the S&P 500 Index remains negative. Hold for now but liquidate on a break above resistance at $30.20.
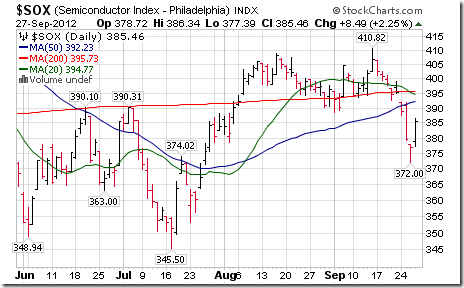
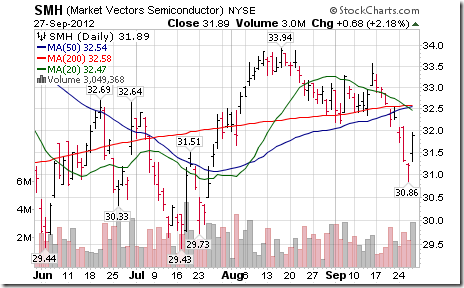
August 28: Sell the Semiconductor sector
Philadelphia Semiconductor Index: 397.04. Current level: 385.46
Period of seasonal weakness: End of August to October 9th
Comment: Technicals remain weak despite yesterday’s gain. Intermediate trend is down. The Index fell below its 20, 50 and 200 day moving averages last week. Strength relative to the S&P 500 Index remains negative. Short term momentum indicators are oversold. Hold for now.
INVESTMENT COMMENTARY
Thursday, September 27, 2012
CONTACTING CASTLEMOORE
If you would like to discuss your portfolio with us – Am I on the right track? Do I have too much risk? Do I have a reasonable game plan? – or receive the latest issue of our bi-monthly newsletter, CastleMoore Investment News, where we write on the big picture stuff, please register for the Investor Centre section of our website: http://www.castlemoore.com/investorcentre/signup.php.
TOP ASSET CLASSES AND SECTORS: HEAT MAPPING
Comments:
There is still a push for “risk-on” assets as of the close of last Friday. This week’s close will undoubtedly show a slight uptick in strength for the “risk-off” or defensive assets such as bonds in the “Asset Class” table, telecom or healthcare in the TSX and S&P, and the US or Switzerland in the country rankings.
That said, we anticipate and are positioning for another upside move in the cyclicals before things get muddy later in the year.
For asset managers the most important thing to get right is the allocation between equities, bonds, bullion cash and currencies. (If you are a Broker or Advisor and would like to learn more about CMI Advisory Service please contact us by phone or e-mail. Robert 905.847.1125)
CHARTS of the WEEK
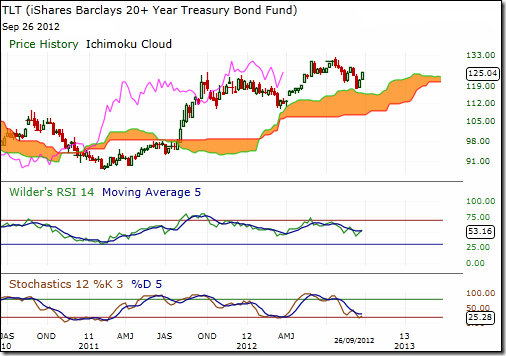
US Long Bonds
Long bonds, as presented here by the 20+yr ETF, show strong support above the cloud with indicators trying to bottom. We currently own 20% in CDN long bonds, but will look to raise overall bond allocation over the next while. Minimal upside for the Loonie will allow us to add US bond holdings.
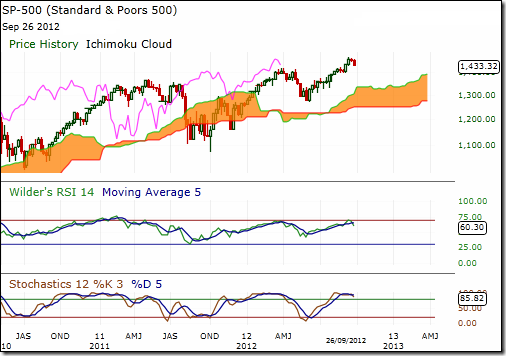
S&P 500
Similarly the S&P shows strong support below, though the market is over extended at the moment. When comparing the two assets classes – US bonds to US stocks – a balanced approach is warranted by the evidence until further notice.
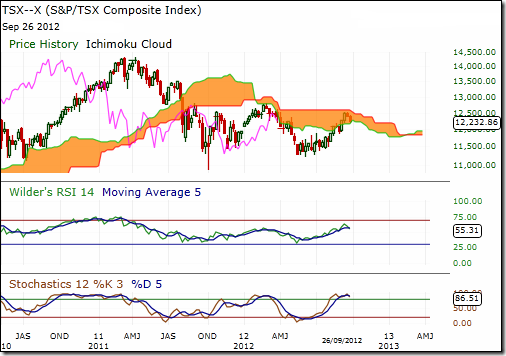
TSX
The TSX on the other hand appears to be now hitting resistance overhead on this weekly chart. A break above these levels would broaden the case that the TSX has only moved up from front-running the QEternity move by the US Fed. The case beyond has yet to be proven.
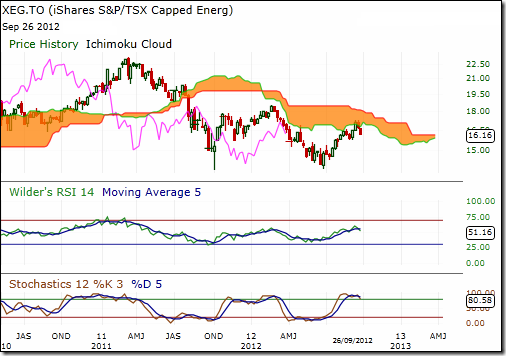
CDN Oil Stocks
The same pattern is reflected in CDN oil stocks. We own Husky as a conservative way to play the space – decent balance sheet (S&P quality ranking A-) and good yield (4.75% from our ACB)
CDN Gold Producers
Gold producers on the other hand have appeared to make the case, though a correction is in the works. When we look at our individual TSX company rankings on a weekly basis 7 of the top 11 are senior gold producers. Something is afoot; we’ll now gauge the persistence beyond what can just be a seasonal play.
If you like to receive bi-monthly newsletter, know more about our model portfolios or access an audio file of our investment philosophy, “Modern Financial Fiascos”, click on the link:
http://www.castlemoore.com/investorcentre/signup.php.
CastleMoore Inc. uses a proprietary Risk/Reward Matrix that places clients with minimum portfolios of $500,000 within one of 12 discretionary portfolios based on risk tolerance, investment objectives, income, net worth and investing experience. For more information on our methodology please contact us.
CastleMoore Inc.
Buy, Hold…and Know When to Sell
This commentary is not to be considered as offering investment advice on any particular security or market. Please consult a professional or if you invest on your own do your homework and get a good plan, before risking any of your hard earned money. The information provided in CastleMoore Investment Commentary or News, a publication for clients and friends of CastleMoore Inc., is intended to provide a broad look at investing wisdom, and in particular, investment methodologies or techniques. We avoid recommending specific securities due to the inherent risk any one security poses to ones’ overall investment success. Our advice to our clients is based on their risk tolerance, investment objectives, previous market experience, net worth and current income. Please contact CastleMoore Inc. if you require further clarification on this disclaimer.
Eric Wheatley’s Listed Options Column
Good morning everyone,
Last week I looked at two options-related emails my Boss had received prior to his last appearance on BNN. There was a third which needs to be addressed here:
Peter in Mississauga asked “Many investors use the covered call strategy for downside protection but the risk is always there that the underlying could be called away. Recently Novartis (NOV) has had a good run up from $69 to $70.50 but the $70 covered call options expired. Can you discuss your recommended strategy to eliminate the damage? Is covering the current short and selling the covered call one month further out at approximately the same price point a consideration?”
“Eliminate” the “damage”.
For those of you who follow the NFL, you’ll sometimes hear of players who refuse to play because they consider themselves to be underpaid. The media will harp upon the fact that a running back is “only” making a million dollars for the season. What is ignored is that the player, upon signing his contract, received a fifteen million dollar signing bonus. This amount is paid up front and is the guaranteed portion of a contract. Yearly salaries aren’t guaranteed and an underperforming player can be cut from a team at any time without further compensation. Of course, the player who is making a fraction of his colleagues’ salaries feels disrespected, forgetting that he wilfully signed a contract which paid him quite handsomely ahead of time.
Peter in Mississauga is going through the same kind of cognitive dissonance NFL players who hold out do. He sold a call and received cash up front in exchange for giving up his stock’s upside beyond the call’s strike price. After the stock’s price had risen, Peter saw “damage” and wants to “eliminate” it. Of course, the damage is purely psychological and can’t be eliminated ex post facto. This is because, if Peter were to want to buy back his call, he would be paying the intrinsic value by which the stock has risen beyond the call’s strike price so he would still be owning the shares at the strike price on a net basis (on top of having paid a bid/ask spread and the fees for a trade).
As we’ve mentioned previously, covered call writers should WANT the stock’s price to rise. In this case, if NOV goes beyond $70, Peter makes his maximum profit. A proper, rational person doesn’t care whether the stock goes to $70.50 or $150, because the rational person made a good return on the call’s premium PLUS a little upside gain if the call was out-of-the-money when sold. Peter is prey to regret aversion, by which he will rue his writing of a call if the “worst-case” scenario happens. Similarly, people who are regret-averse find it very difficult to take profit on a stock which has risen, fearful that the stock may continue to rise and that they would miss out on further gains. Of course, if you never take profit, you’ll never make money.
As to people who are averse to getting assigned, I have a little story: I manage my mom’s money (I mention this only because my mom wouldn’t mind my exposing one of her holdings). Last week, she got assigned on her XIU October 17 calls when the stock was trading at roughly $17.60. Now, Peter would be pee-owed at this, but I was quite ecstatic. This is because I had gotten a very nice return on the premium – 41 cents per share when the stock was at $16.80 –for three months when I wrote them in July. As it turned out, I got an extra month for free, because the October call was assigned at the September expiry. I’m now able to write further calls right now instead of waiting until October’s expiry. This extra month is far from bad news; of course, Peter’d be looking at the sixty cents he’s forgoing and would sulk.
*****************
This week’s Twitter feed:
· Found a wonderful blog by a fellow Montrealer who is a big-shot economist. I’ve dedicated some very prime browser real-estate to him with a dedicated tab
· Take junk bonds, lever them, get inflows from retired people.
· We are portfolio managers who manage money with a long-term view. Much of that view will be formed by China and its entry into the developed world. Or not. There are still a LOT of growing pains yet to come.
In this week’s French-language blog: my rules on life and investing, gleaned from my many screwups.
Cheers!
Éric Wheatley, MBA, CIM
Associate Portfolio Manager, J.C. Hood Investment Counsel Inc.
eric@jchood.com
514.604.2829; 1.855.348.2829
Twitter: @jchood_eric_en
Blogue en français : gbsfinancier.blogspot.ca
*****************
Little known fact about John Charles Hood #45
John Charles Hood only has one hard and fast rule which he uses in various circumstances: “Don’t get any on you”.
Special Free Services available through www.equityclock.com
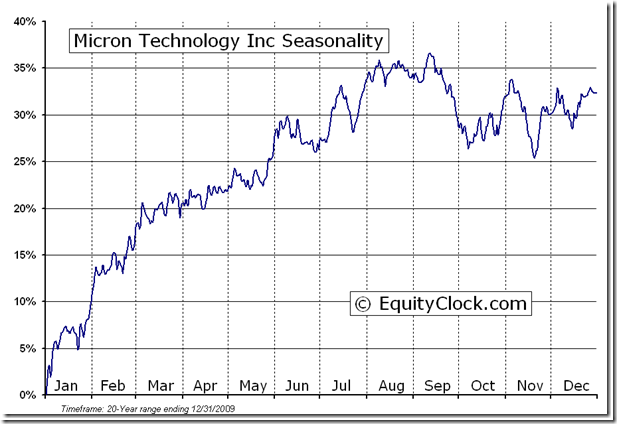
Equityclock.com is offering free access to a data base showing seasonal studies on individual stocks and sectors. The data base holds seasonality studies on over 1000 big and moderate cap securities and indices.
To login, simply go to http://www.equityclock.com/charts/
Following is an example:
Micron Technology, Inc. (NASDAQ:MU) Seasonal Chart
Disclaimer: Comments and opinions offered in this report at www.timingthemarket.ca are for information only. They should not be considered as advice to purchase or to sell mentioned securities. Data offered in this report is believed to be accurate, but is not guaranteed.
Don and Jon Vialoux are research analysts for Horizons Investment Management Inc. All of the views expressed herein are the personal views of the authors and are not necessarily the views of Horizons Investment Management Inc., although any of the recommendations found herein may be reflected in positions or transactions in the various client portfolios managed by Horizons Investment Management Inc
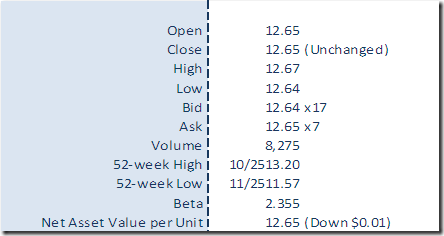
Horizons Seasonal Rotation ETF HAC September 27th 2012



![clip_image002[9] clip_image002[9]](https://advisoranalyst.com/wp-content/uploads/HLIC/bd6dfb60fe467cbb2542ad2ce46246b7.png)
