Upcoming US Events for Today:
- New Home Sales for August will be released at 10:00am. The market expects 380K versus 372K previous.
- Weekly Crude Inventories will be released at 10:30am.
Upcoming International Events for Today:
- German Consumer Price Index for September will be released at 8:00am EST. The market expects a year-over-year increase of 1.9% versus 2.1% previous.
- China Industrial Profits for August will be released at 9:30pm EST.
The Markets
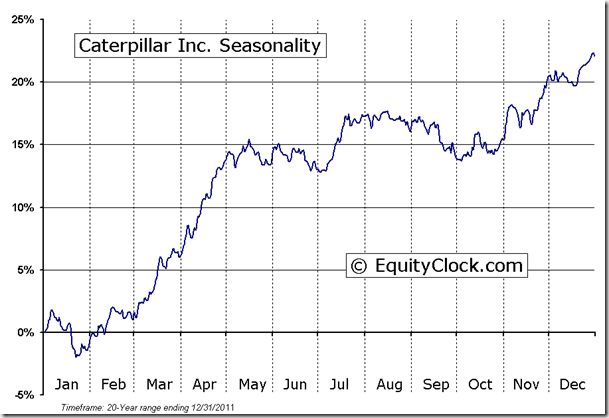
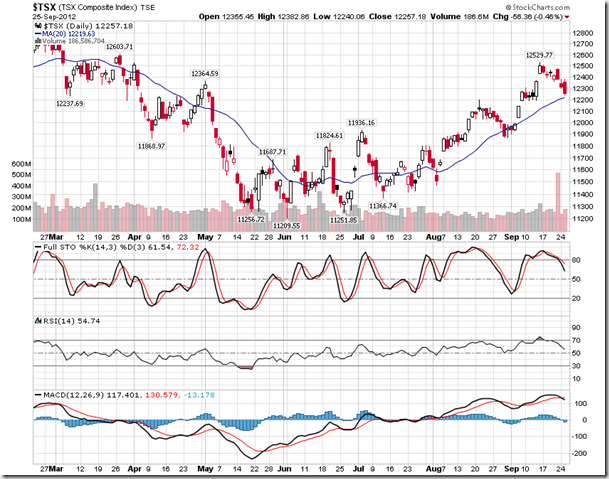
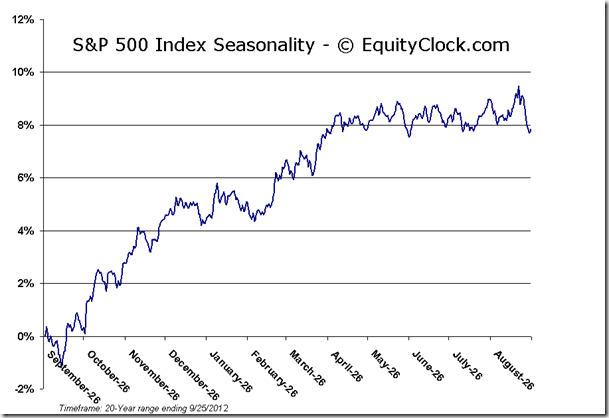
Markets traded sharply lower on Tuesday as doubts over the efficacy of QE3 began to flourish following comments from Federal Reserve Bank of Philadelphia president Charles Plosser who indicated that “we are unlikely to see much benefit to growth or to employment from further asset purchases.” Cyclical stocks saw the greatest declines, led by Caterpillar, which cut its earnings forecast for the next few years. Shares of Caterpillar were the worst performer in the Dow, falling 4.25% during the session. Seasonal tendencies for the industrial titan remain flat to negative into the month of October, leading into the period of seasonal strength that kicks off in full force in November and December.
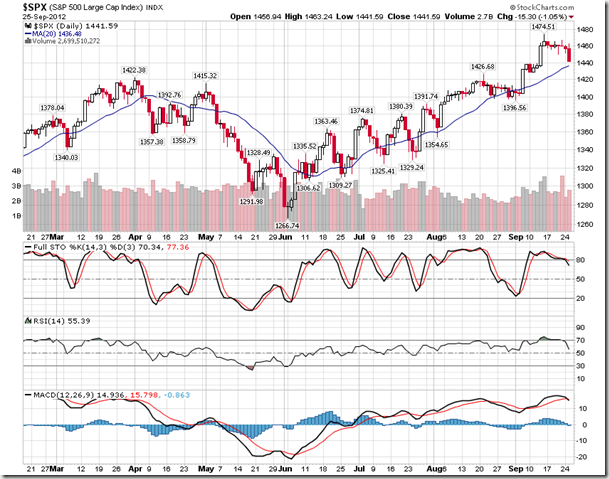
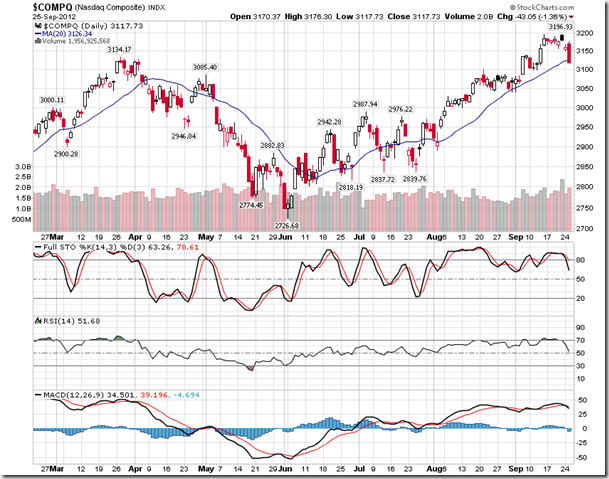
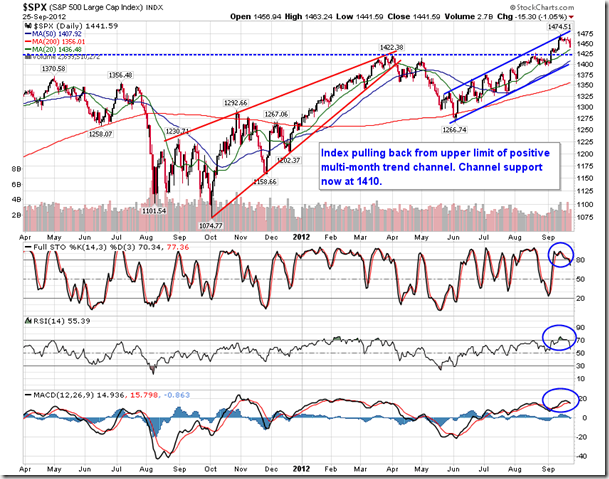
Prior to Tuesday, the S&P 500 Index had not seen a declining session exceed 1% since July 20th. Investors would have to look all the way back to June 25th, shortly after the summer rally began, to find a decline in the S&P 500 index larger than the one realized on Tuesday. Still, after seven days of negative pressures within equity markets, benchmarks, such as the S&P 500, have yet to get back to levels last seen prior to the September 13th Fed announcement, the last definitive up-tick day. Equity benchmarks are now looking to initial support at 20-day moving average levels, a dividing line between short-term strength and weakness.
This intermediate average has shown to be a launching point for this rally ever since the beginning of August. However, positive catalysts have also solidified this average as a point of support as optimism pertaining to central bank intervention propels equities higher. A positive catalyst might not materialize in order to save the market this time around with news pertaining to earnings and economic concerns seeming to take the steam out of what was a powerful rally within stock and commodity markets. Commodities have corrected rather sharply over the past few days and equity markets are seeming to follow. The current pullback has the potential to be a multi-week event, but, following this correction, the positive trend is expected to resume as the period of seasonal strength for equity markets begins into October and November.
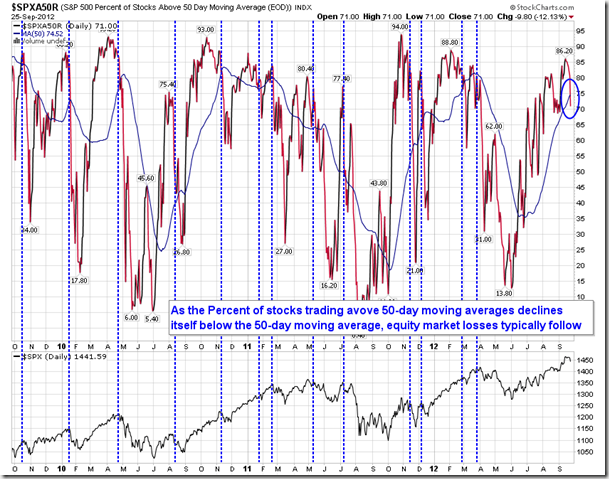
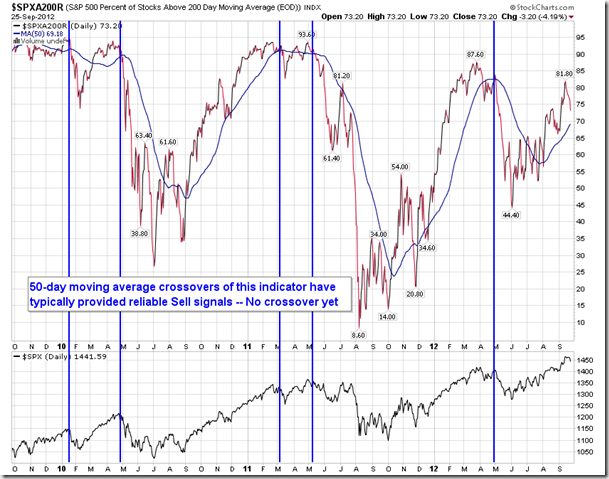
Yesterday we showed you an indication of volatility and how it typically coincided to significant peaks in equity markets whenever the range of activity was substantially low. Another indicator provides similar hints of market peaks. The percent of stocks in the S&P 500 trading above 50-day moving averages has itself fallen below its 50-day moving average line. Crossovers such as this have typically preceded further declines within the S&P 500, implying that weakness has just begun to influence markets lower. Given the volatility of this indicator, it is also prudent to monitor the percent of stocks in the S&P 500 Index trading above 200-day moving averages, which provides similar buy and sell indicators based on 50-day moving average crossovers. As of yet, a crossover has not been revealed, but the push in that direction is apparent. The theory behind the indicator is that as more and more stocks within the S&P 500 give up levels of support presented by significant moving averages, selling pressures then escalate, leading markets lower until equilibrium is once again attained.
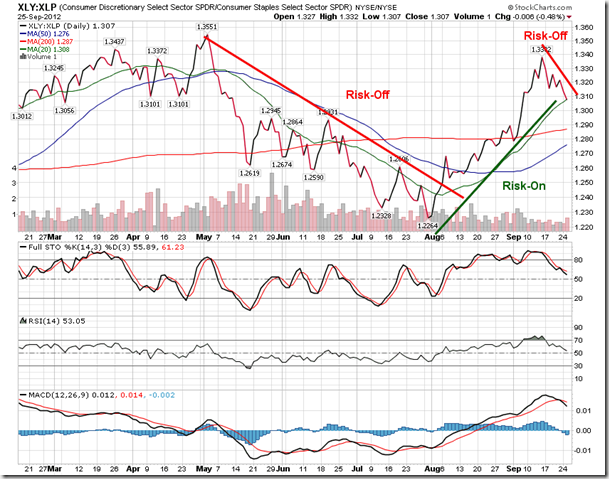
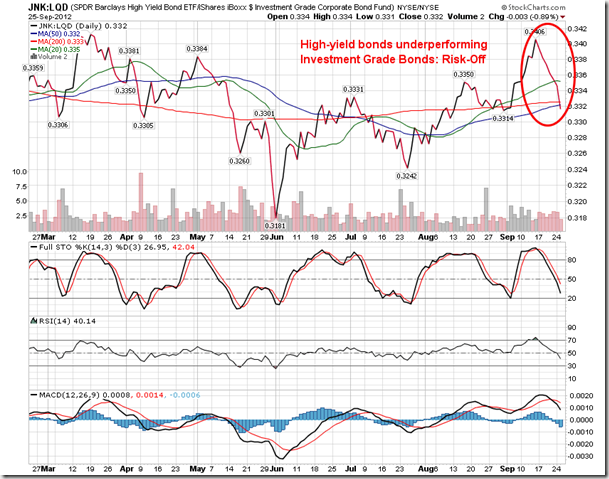
Gauges of risk sentiment are also showing that investors are once again starting to become risk averse. Defensive sectors, such as Staples and Health Care have been outperforming the market over the past few sessions. Even Utilities, the recent market laggard, is starting to show signs of rebounding from a bottom, also outperforming the market over the last few days. A ratio of Consumer Discretionary to Consumer Staples is showing signs of decline, indicating investor hesitation with holding higher beta, cyclically sensitive equities. Even fixed income investors are choosing safer alternatives, opting for investment grade bonds over high yield. Risk aversion is a typical characteristic within a declining trend, suggesting concern for risk assets, at least for the short-term.
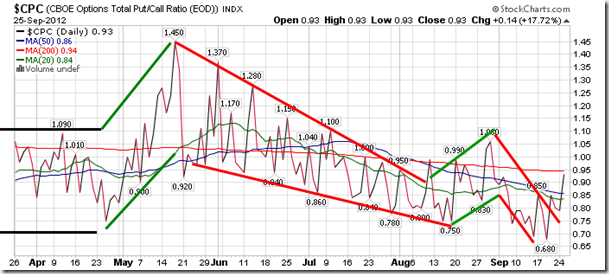
Sentiment on Tuesday, as gauged by the put-call ratio, ended bullish at 0.93. The ratio has come well off of the lows recorded last week of 0.68, the lowest level in over a year. Investors had increasingly become bullish during recent weeks, shedding negative equity bets and tilting the market bias too far in one direction. A correction in equities and sentiment was/is inevitable.
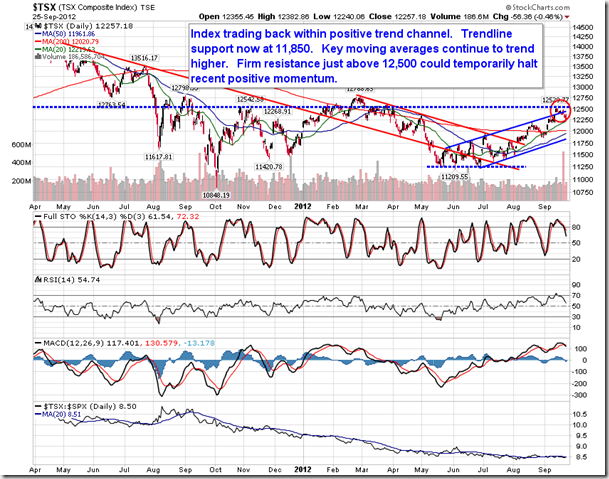
Chart Courtesy of StockCharts.com
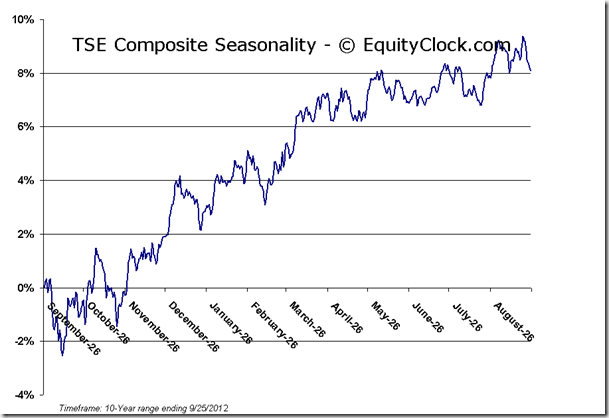
Chart Courtesy of StockCharts.com
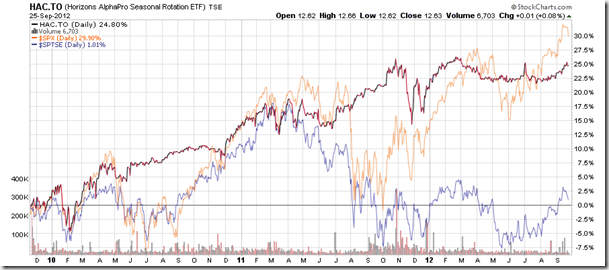
Horizons Seasonal Rotation ETF (TSX:HAC)
- Closing Market Value: $12.63 (up 0.08%)
- Closing NAV/Unit: $12.65 (up 0.03%)
Performance*
| 2012 Year-to-Date | Since Inception (Nov 19, 2009) | |
| HAC.TO | 3.86% | 26.5% |
* performance calculated on Closing NAV/Unit as provided by custodian
Click Here to learn more about the proprietary, seasonal rotation investment strategy developed by research analysts Don Vialoux, Brooke Thackray, and Jon Vialoux.


