Upcoming US Events for Today:
- Case-Shiller 20-city Index for July will be released at 9:00am. The market expects a year-over-year increase of 1.2% versus an increase of 0.5% previous.
- Consumer Confidence for September will be released at 10:00am. The market expects 63.0 versus 60.6 previous.
- The FHFA Housing Price Index for July will be released at 10:00am. The market expects 0.8% versus 0.7% previous.
- The Richmond Fed Manufacturing Index for September will be released at 10:00am. The market expects –4 versus –9 previous.
Upcoming International Events for Today:
- German Consumer Confidence for October will be released at 2:00am EST. The market expects 5.9, consistent with the previous report.
- Canadian Retail Sales for July will be released at 8:30am EST. The market expects a month-over-month increase of 0.2% versus a decline of 0.4% previous.
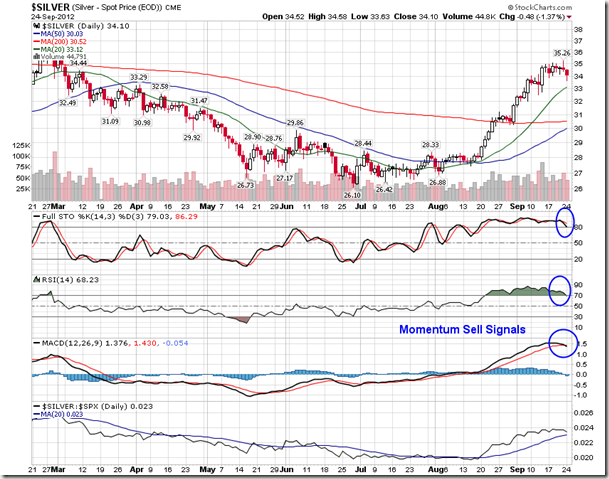
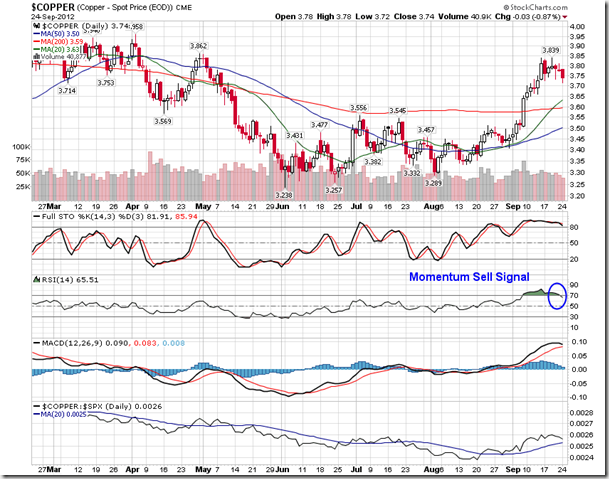
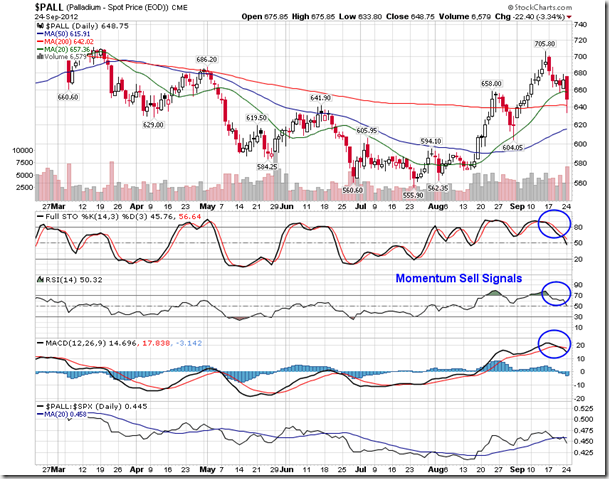
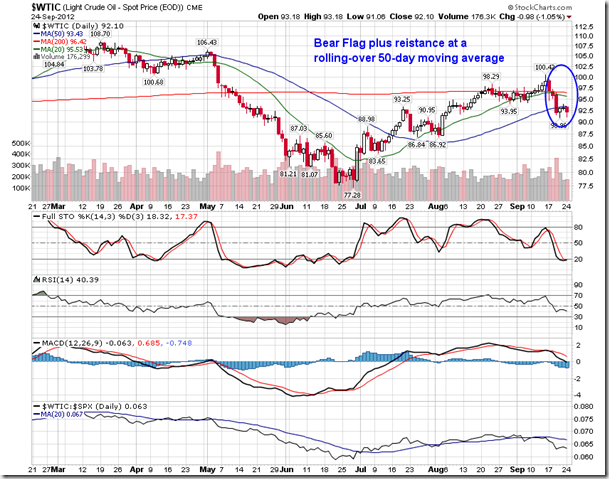
Markets ended lower to start the week as commodities succumbed to selling pressures. Oil, Copper, and Silver each sold off by more than 1%, while Palladium topped them all, producing a decline of 3.34%. Commodity markets began to destabilize last week leading into the quarterly futures expiration date on Friday. A number of commodities produced bearish momentum crossovers with respect to MACD, RSI, and Stochastics. The price action of Crude Oil is even showing a bear flag formation, resisting off of a now broken 50-day moving average, hinting of further declines to come. The period of seasonal strength for oil concludes around this time of year as favourable influences pertaining to the summer driving season come to an end. Other commodities also realize declines into the month of October as the US Dollar typically stabilizes into the start of the new quarter. Momentum sell signals provided today combined with negative seasonal influences give reason to believe that a correction within commodity markets has begun. Many commodities, including Gold and Silver, resume seasonal uptrends into the months of November and December.
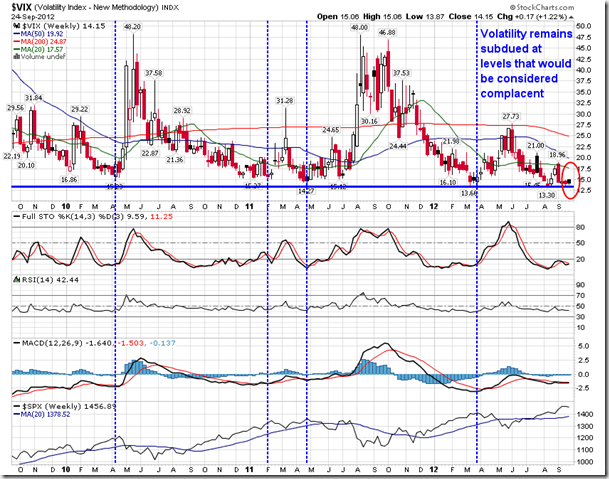
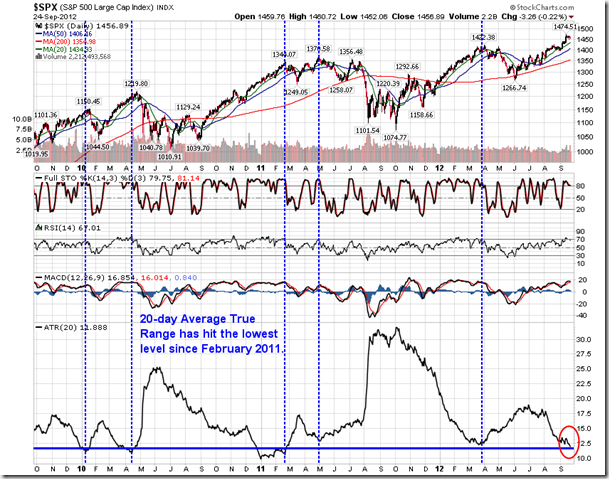
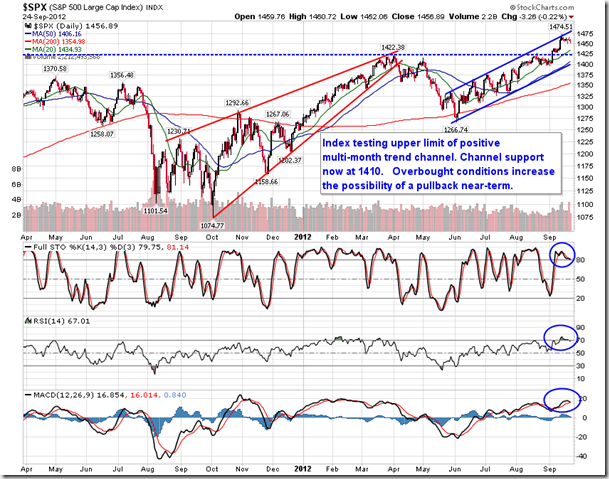
It is well known by now that volatility, as measured by the VIX, remains depressed. The jury is still out as to what this represents: complacency indicative of peaks or bullishness indicative of further gains to come. Over the past three years when the VIX has fallen to current levels of apparent support, a correction in equity markets has typically followed. Another gauge of volatility is also showing a similar stat. The 20-day Average True Range for the S&P 500 has fallen to the lowest levels since February 2011. Over the past three years as the 20-day Average True Range hit levels equivalent to what is presently being realized, an intermediate top in equity markets is typically confirmed within the days to follow. Yesterday we reported that the S&P saw the tightest 5-day closing range last week since 1989, suggesting debate amongst investors as to whether further buying is justified given present equity valuation and uncertainty surrounding the upcoming earnings season. Volatility is more indicative of bear market conditions, so the fact that volatility itself is subdued doesn’t necessarily mean a significant peak is confirmed, but investors may be reluctant to chase at present levels given the late stages of the equity market rally.
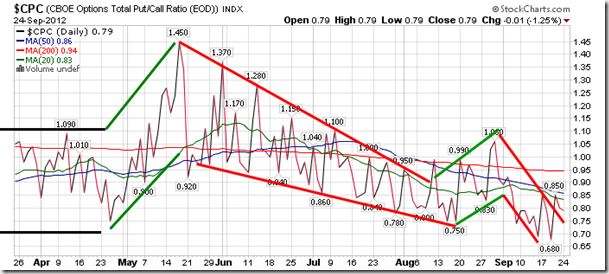
Sentiment on Monday, according to the put-call ratio, ended bullish at 0.79.
Chart Courtesy of StockCharts.com
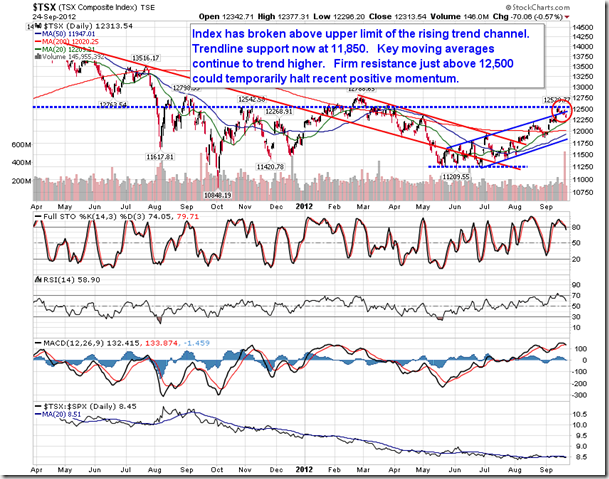
Chart Courtesy of StockCharts.com
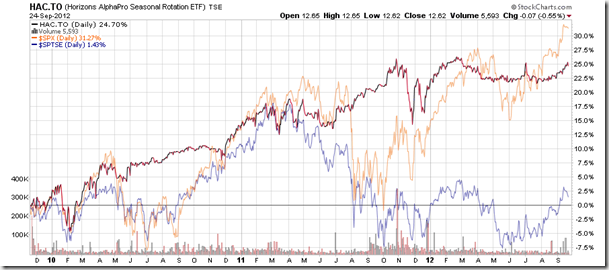
Horizons Seasonal Rotation ETF (TSX:HAC)
- Closing Market Value: $12.62 (down 0.55%)
- Closing NAV/Unit: $12.65 (down 0.38%)
Performance*
| 2012 Year-to-Date | Since Inception (Nov 19, 2009) | |
| HAC.TO | 3.86% | 26.5% |
* performance calculated on Closing NAV/Unit as provided by custodian
Click Here to learn more about the proprietary, seasonal rotation investment strategy developed by research analysts Don Vialoux, Brooke Thackray, and Jon Vialoux.


