September 18, 2012
by Liz Ann Sonders, Senior Vice President, Chief Investment Strategist, Charles Schwab & Co., Inc.
Key Points
- Households have been in deleveraging mode steadily since 2008.
- The Fed has stepped in to ease deleveraging's pressures on economy, but its zero-interest-rate policy has hurt savers.
- Public-sector deleveraging is up next, while the total process will take a very long time.
In October 2008 I wrote a report, in the wake of the fall of Lehman Brothers, titled "A Transformational Era of Deleveraging." It happened to be one of the most widely read reports I've written, and in today's report I want to revisit the topic—specifically how far we've come within the US household sector.
The global credit crunch that was brewing before Lehman imploded kicked into high gear with the fall of that institution in mid-September of 2008. It began with the household sector, upon which a massive era of deleveraging was forced. Since then the Federal Reserve has stepped in with three rounds of quantitative easing (QE) to stem the natural tide of deflation that's historically accompanied nearly every global debt crisis.
At present, there's growing pressure on the public sector to begin its deleveraging process, either because we fall off the "fiscal cliff" at year-end or our politicians step up to the plate and begin the process on their own. So what we face is a standoff between monetary and fiscal policy-makers that are attempting to inflate … with a private sector that's in the process of deflating.
To put numbers to the battle, at the peak in the debt bubble there was $42 trillion in private-sector debt and $14 trillion in public-sector debt. The private sector is deleveraging as fast as it can while the public sector is inflating. History shows that the private sector typically wins the deflation-inflation battle, and that's why the Fed has been as aggressive as it ever has historically.
Higher debt … lower growth
Total credit-market debt is the broadest and most inclusive measure of debt, and as you can see in the top chart below, the recent improvement is barely a dent when looking longer-term. The massive increase in debt also helps to explain not only this cycle's anemic recovery, but the string of relatively weak recoveries since the early 1980s' double-dip recession.
Rising Debt = Faltering Recoveries
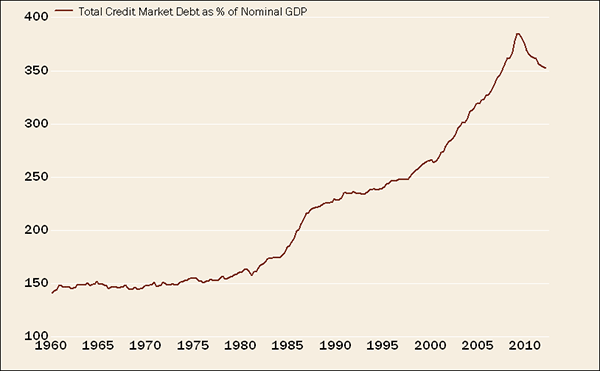
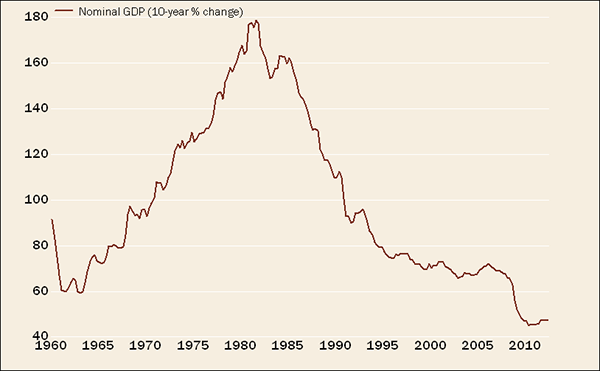
Source: Bureau of Economic Analysis, FactSet, Federal Reserve; credit-market debt as March 31, 2012, nominal GDP as of June 30, 2012.
The second chart above shows the rolling 10-year rate of growth of gross domestic product (GDP) since 1960. Up until about 1980, nearly every rolling 10-year period was more prosperous than the prior period. That trend came to an abrupt halt, not coincidentally, at the point the total debt began its steep ascent.
The reasons behind the debt ascent are well documented:
- A 30-year record-breaking decline in interest rates allowed borrowers to carry more debt.
- Financial innovations/debt securitizations and politicians pushing for broader home ownership led banks to dramatically loosen lending standards.
- Housing and consumer-durables demand accelerated sharply coming out of World War II (WWII).
- Increased use/availability of credit cards and home equity lines/mortgage refinancings.
- The Fed's easy-money policy, particularly since the 1990s.
With the notable exception of the last reason, most of these trends are no longer in play. That said, there's ample pent-up demand for housing and it appears that headwind is slowly becoming a tailwind.
Adding salt to the debt wound, the last cycle's debt binge was largely for extra consumption and housing. When excess lending is used to finance investments, it creates an income stream for paying debts down the road. On the other hand (as in Europe more recently), when debt is used for extra consumption and housing, it does not create a future income stream and as a result, interest and repayment obligations take a larger bite out of income.
We now have a clash underway between a household sector that's been in deleveraging mode since 2008 and a government sector that's seen debt blow out to historical levels, largely as it has tried to support an economy suffering under the weight of household-sector deleveraging.
The paradox of thrift
The US consumer has had a growing and disproportionate impact on GDP for decades. When the subprime mortgage market began its epic unwinding in mid-2007, the attendant ripple effects came into view. Even today, real per capita personal consumption expenditures remain 13% below the long-term trend. No other post-Depression recession came close to matching that contraction and can easily be explained by the busting of household balance sheets.
In the post-WWII period, private -sector debt grew more rapidly than nominal GDP in nearly every year except those during recessions. The result was a peak in the outstanding level of private-sector debt at nearly 180% in 2007, up from a little more than 50% in the early 1950s. Both household debt and business debt have decreased from their peaks, but much more work needs to be done.
The biggest problem remains existing mortgage debt. According to BCA Research, mortgage debt is currently about 60% of the value of household real-estate assets, compared with a pre-crisis average of about 40%. And because about one-third of homeowners have no mortgage, the position of mortgage holders is much worse than the aggregate data suggest. According to Zillow, more than 30% of mortgage holders were underwater with their mortgages in the second quarter of this year.
Low rates may hurt more than help
Indeed, today's near-zero short-term interest rates, and record low longer-term rates ease the loan-delinquency problem and improve debt-servicing capabilities, as the charts below show.
Plunging Delinquencies
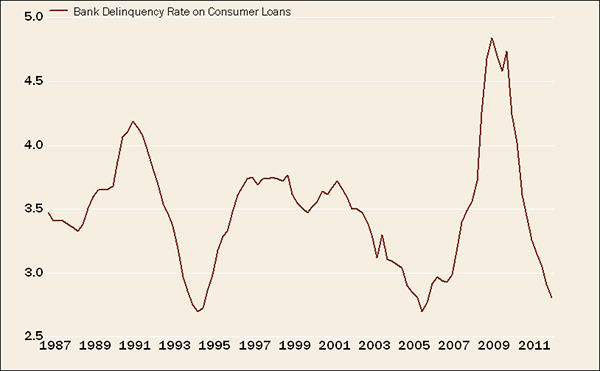
Source: FactSet, Federal Reserve, as of June 30, 2012.
Plunging Debt-Service Ratio
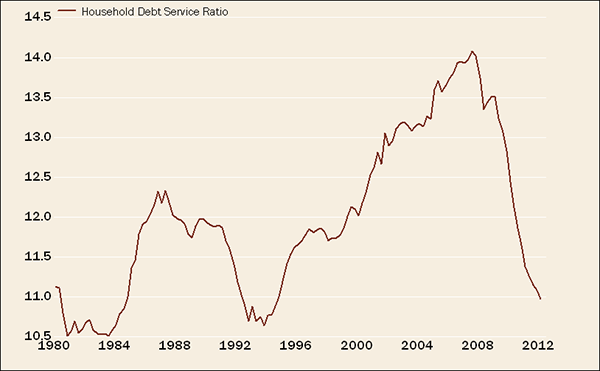

Source: FactSet, Federal Reserve, Ned Davis Research, Inc. (Further distribution prohibited without prior permission. Copyright 2012 (c) Ned Davis Research, Inc. All rights reserved.), as of March 31, 2012. Household debt service ratio is an estimate of ratio of required debt payments to disposable personal income. Required minimum payments of interest and principal on outstanding mortgage and consumer debt are included. Circle indicates current range.
But before you get too excited about the table above—showing that we're presently in a debt-service zone that's historically been met with strong economic and job growth—remember that the burden of public-sector debt has never been higher and is beginning to bear down on the economy.
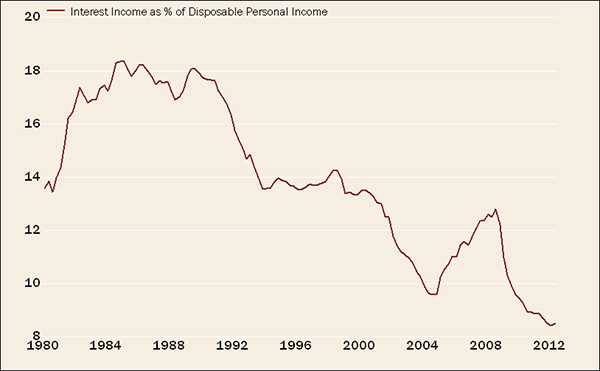
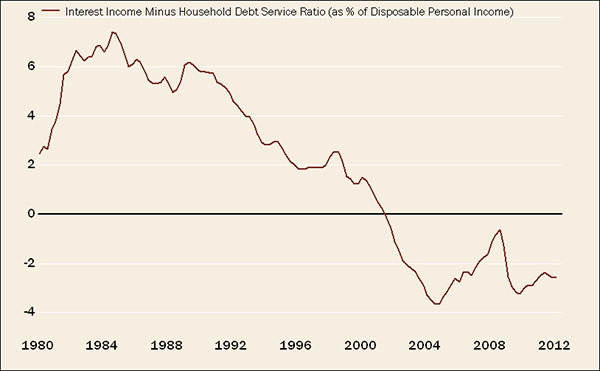
In addition, there's a rub to low rates. BCA notes that the household sector has more interest-earning financial assets than liabilities: $13.8 trillion versus $12.8 trillion respectively, as of the first quarter of 2012. Extremely low interest rates represent an overall negative in income flow terms. And that problem has now been extended thanks to the Fed's recent announcement of QE∞ (with infinity a symbol of its open-ended structure). Indeed, debt-servicing costs have dropped by 3.1% of disposable income in the past five years, while interest receipts have dropped by 3.9% of income over the same period.
That's why, as seen below, the net of interest receipts minus debt service payments remains in negative territory. This is an even bigger problem for the elderly.
Debt Service Down … But So is Interest Income
Source: BCA Research, Bureau of Economic Analysis, FactSet, as of June 30, 2012.
Most of the data above highlight the likely long path ahead for what could be deemed a full recovery in private-sector balance sheets. In addition, given the uniquely severe nature of the debt crisis, it's unlikely that a simple reversion to the longer-term trend will suffice. Given the massive upside overshoot in debt, one can expect a downside undershoot relative to the trend. This is why when I look at household debt as a percentage of disposable income, I note both the standard trend line and a trend line that excludes the bubble years (see below).
Debt Breaks First Trend Line
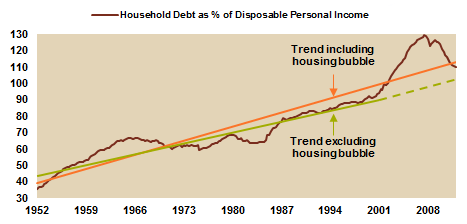
Source: FactSet, Federal Reserve, as of March 31, 2012. Orange and green lines represent trend lines.
The future
Trying to extrapolate trends into the future is difficult. Attempting to simplify the process, BCA assumes that nominal household income will grow at about 5% a year, and that the level of outstanding debt remains flat. On that basis, the debt-to-income ratio would return to its current upward-sloping trend line by the end of 2014. If the ratio were to return to its average of the 1990s, then it would take until the end of 2018 to return to that level, assuming zero debt growth over the period. If debt levels continued to contract, then the deleveraging process would end more quickly. That scenario, of course, would be more disruptive to the economy.
In sum, it's going to be a long slog. As hard as they may try, neither the Fed nor the federal government can "create" strong economic growth; at best, they can keep the economy from sliding back into a recession. But the drag on growth from household deleveraging is easing and housing is again becoming an economic "green shoot." At the same time, corporate balance sheets are in great shape and the financial sector's health has improved markedly since the housing bubble burst. So, it's no longer all bad.
Important Disclosures
The information provided here is for general informational purposes only and should not be considered an individualized recommendation or personalized investment advice. The investment strategies mentioned here may not be suitable for everyone. Each investor needs to review an investment strategy for his or her own particular situation before making any investment decision.
All expressions of opinion are subject to change without notice in reaction to shifting market conditions. Data contained herein from third party providers is obtained from what are considered reliable sources. However, its accuracy, completeness or reliability cannot be guaranteed.
Examples provided are for illustrative purposes only and not intended to be reflective of results you can expect to achieve.


