September 4, 2012
by Liz Ann Sonders, Senior Vice President, Chief Investment Strategist, Charles Schwab & Co., Inc.
Key Points
- Earnings growth has peaked, but don't necessarily assume the same about margins.
- Present pace of earnings growth has historically been accompanied by decent market performanc.
- Margins are increasingly driven by domestic and foreign earnings, but peaking margins have historically been accompanied by strong market performance.
Investors are returning from their summer vacations and getting ready for what could be a very interesting final quarter of 2012. August was fairly quiet, which was a great relief given the fireworks of the past several years. We're also in the lull period between second- and third-quarter earnings reports. Second-quarter earnings season was an interesting one in that it highlighted the effect on stocks of an expectations bar that had been lowered quite dramatically. Stocks, at least in the short term, often move more on relative-to-expectations rather than on absolute fundamentals.
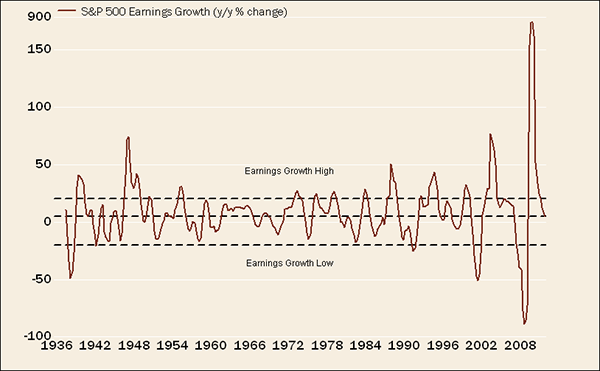
Earnings growth has undoubtedly peaked from its torrid pace coming out of the Great Recession, but frankly, that was to be expected. As you can see in the chart below, both the plunge in earnings during the recession and the subsequent recovery from those depths were both unprecedented in history.
Earnings Growth Slowing

Source: FactSet, Ned Davis Research (NDR), Inc. (Further distribution prohibited without prior permission. Copyright 2012© Ned Davis Research, Inc. All rights reserved.), Standard & Poor's, as of August 31, 2012.
One could argue that we've returned to a more normal band and pace of growth that, historically, has been decent for stock market performance, as you can see below. Interestingly, were growth to slip a bit more, we'd actually move into what has been the best zone historically for stock market performance.

Source: NDR, Inc. (Further distribution prohibited without prior permission. Copyright 2012© Ned Davis Research, Inc. All rights reserved.). March 31, 1927-August 31, 2012. Circle indicates current range.
The earnings surge coming out of the recession was unprecedented in magnitude, but not in concept. Earnings do tend to rebound quite sharply during the initial stages of bull markets, which in turn tend to lead economic rebounds. Also consistent historically has been the slowing in the pace of that growth as the bull market ages. What happens then, typically, is that in the more-mature phases of bull markets, the heavy lifting tends to come from valuations expanding, not earnings continuing to grow.
In other words, we now need to rely more on the P (prices) than the E (earnings), leading to an expansion of the P/E ratio. Fortunately, the multiple on forward earnings for the S&P 500 presently is just greater than 13, which is about three multiple points below the long-term median.
Taking it from the top down, revenue (or "top line") growth is slowing. S&P 500 revenues are highly correlated with manufacturing and trade sales. Those are a component of the Index of Coincident Indicators and also a metric partly used to define recessions' start and end dates. As of July, those sales are up 3.5% year-over-year, a relatively slow pace. Revenues for the S&P 500 were up only 0.3% quarter-over-quarter in the second quarter and up less than 2% versus a year ago. That's the slowest pace of revenue growth since the third quarter of 2009.
Analysts are also still giving haircuts to their revenue growth estimates for the remainder of this year and next year. According to Yardeni Research, as of mid-August, the consensus expectation for 2012 and 2013 revenue growth is 2.7% and 4.1%, respectively.
Earnings growth, however, is expected to continue to exceed revenue growth. Thomson Reuters shows consensus is for S&P 500 earnings to rise 6.3% this year and 11.7% next.
Profit margins … more than meets the eye
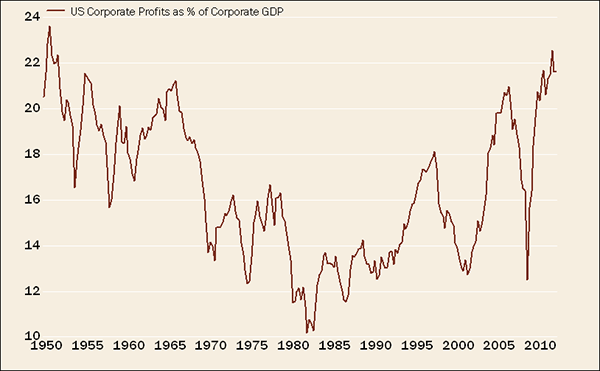
Of course, when doing the math, the only way for earnings growth to outpace revenue growth is for profit margins to continue to expand. One of the better proxies for margins is overall US pre-tax corporate profits relative to US corporate gross domestic product (GDP). Rather than looking at profit margins of publicly traded companies (e.g. the S&P 500), this measure focuses on corporate-sector profits for all US companies based on national income data, a concept pioneered by BCA Research. You can see a chart of this margin proxy below.
Margins Nearing 60-Year High

Source: BCA Research, Bureau of Economic Analysis, FactSet, as of June 30, 2012. Corporate Profits are pre-tax with inventory valuation and capital consumption adjustments.
Today's elevated margins are approaching the highly profitable years of the 1950s. But it's important to note the key difference between economic conditions of the two eras. In the 1950s, the US economy was essentially a closed system, with foreign trade and overseas investment much, much lower than today. As such, an even better measure of today's margins should have profits assessed in relation to both domestic and foreign sales. Unfortunately, national income accounts do not track such data, and as a result, using the more-common measures of profit margins can and likely will be misleading. As per a recent BCA report:
- "…consider a previously 'purely' domestic firm that starts generating foreign sales equal to domestic sales. If new foreign sales produce a similar amount of foreign profits per dollar as domestic sales, then underlying margins will remain stable. Meanwhile, when measured as total profits relative to domestic sales only, it could appear that margins have risen and should 'mean revert.' A similar analogy could be extended to a specific industry or to an entire economy."
Homing in on domestic margins
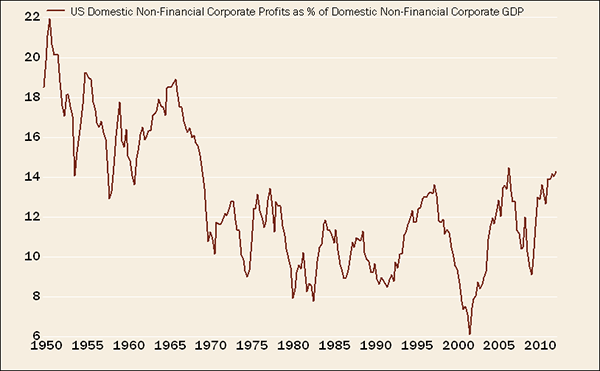
A ratio that compares domestic profits with domestic sales avoids such bias. The chart below, put together with the aid of BCA, plots domestic non-financial profits as a percentage of domestic non-financial corporate GDP.
Domestic Margins Less Stretched

Source: BCA Research, Bureau of Economic Analysis, FactSet, as of June 30, 2012. Corporate Profits are pre-tax with inventory valuation and capital consumption adjustments.
When measured this way, profit margins look significantly less elevated. With globalization in full force, foreign earnings' contributions to US profit growth should continue to expand, suggesting that margins may continue to diverge somewhat from the US business cycle, and that their upward trajectory may not be soon interrupted (barring a synchronized global recession).
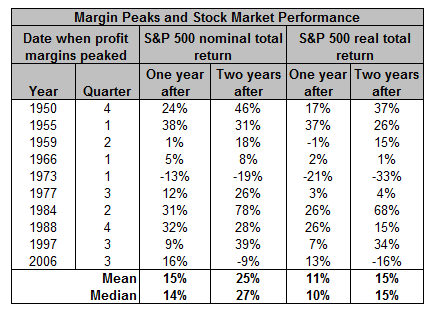
As for the margin cycle's implications for the stock market, you can see in the table below that stock market performance following margin peaks has been healthy. That said, as mentioned, we may not even be at a margin peak yet.

Source: BCA Research. 1950-2012. Profit Margins defined as total pre-tax corporate profits relative to corporate GDP.
As long as the level of profits remains fairly high, the growth rate of those profits doesn't sink measurably, margins remain healthy and valuations remain reasonable, the stock market should behave.
Important Disclosures
The information provided here is for general informational purposes only and should not be considered an individualized recommendation or personalized investment advice. The investment strategies mentioned here may not be suitable for everyone. Each investor needs to review an investment strategy for his or her own particular situation before making any investment decision.
All expressions of opinion are subject to change without notice in reaction to shifting market conditions. Data contained herein from third party providers is obtained from what are considered reliable sources. However, its accuracy, completeness or reliability cannot be guaranteed.
Examples provided are for illustrative purposes only and not intended to be reflective of results you can expect to achieve.
Copyright © http://schwab.com


