Rethinking How We Invest
by Matt Scales, Columbia Management
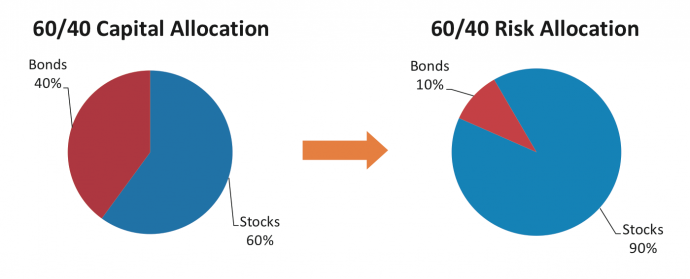
Building portfolios to meet individual objectives is or should be a customized exercise, so this article should not be considered advice for any individual. Instead, it is an alternative philosophy to how investors have traditionally approached building portfolios. For the vast majority of us, we allocate our capital to asset classes with the highest expected returns. The most common result of this process has been the 60/40 portfolio (60% stocks, 40% bonds). The problem is that allocating capital is very different than allocating risk (which we define as volatility). Because stocks, on average, are more volatile than bonds, the risk in this portfolio is almost entirely concentrated in stocks.
For many investors, they intuitively understand this and have the time horizon and confidence that stocks will ultimately reward them. For others, an alternative to this approach may have some appeal – not because stocks are a poor investment, but because certain investors may not be comfortable concentrating their risk in a single asset class. There are many historical examples where single asset classes can struggle over long periods of time. And when the drivers of that single asset class where we have concentrated our risk turn sour, the effects can be devastating. Think of a retiree living off the fixed income stream generated by a portfolio of U.S. Treasury bonds back in the inflationary 70’s. Inflation erodes the spending power of nominal fixed income securities. That retiree would have lost one-third of their real spending power over the 16 year period from 1965 to 1981, inflation delivering a shock that perhaps they would have been unable to absorb at that stage of their life1.
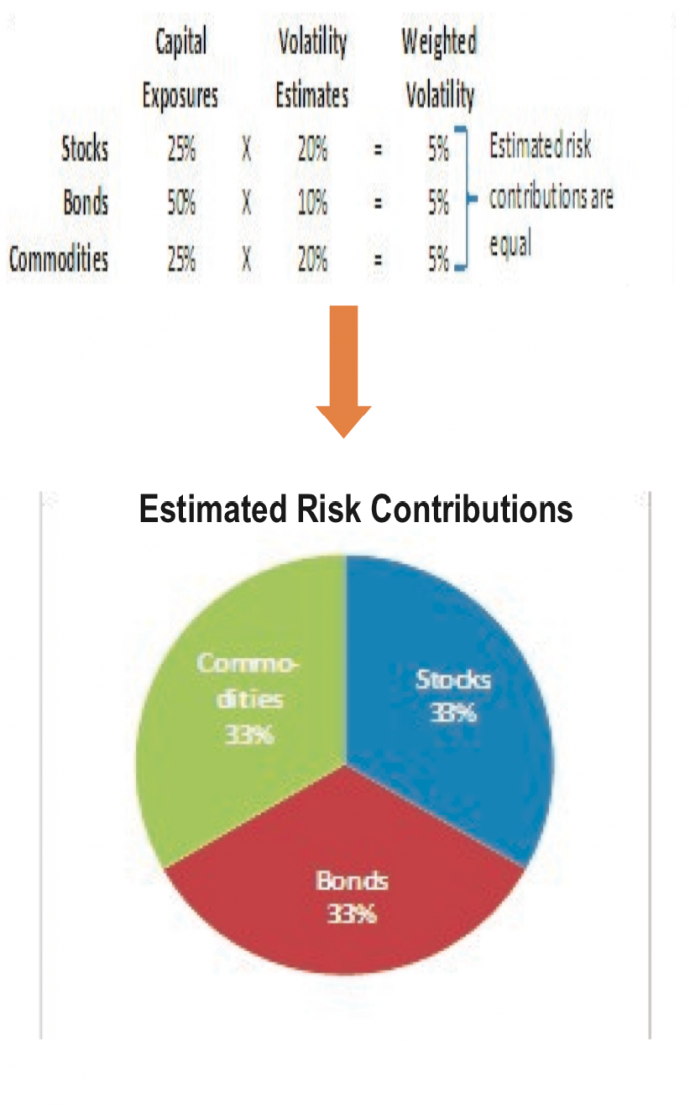
Ultimately, risk contributions are a major factor that drives portfolio returns. Certain investors have the confidence and ability to determine which asset classes are most attractive and thereforewheretoconcentratetheirportfoliorisk. That skill set is very valuable. For those that do not, balancing risk to asset classes that respond independently to different economic and market drivers may help smooth out the return experience. For example, stocks tend to perform well during healthy economic environments while bonds can provide protection during spikes in volatility and sluggish growth environments. Commodities may provide “real” protection during inflationary environments when both stocks and bonds tend to struggle. The hypothetical example below illustrates from a practical perspective what we mean by balancing risk:
In future Perspectives, we will expand on this topic and incorporate more thoughtsonbuildingportfolios,though again we want to emphasize that every investor has unique circumstances and, therefore, unique portfolio needs. For now, we encourage all investors to better understand how their portfolio is allocated from a risk perspective. It can provide valuable insight into how it may perform during different market environments and what the corresponding impact may be to your wealth.
1. Sources: National Bureau of Labor Statistics (CPI), Barclays Capital and Columbia Management Investment Advisers, LLC.
*****
Fed Action Likely in September
by Zach Pandl, Senior Interest Rate Strategist
The Federal Reserve’s series of unconventional easing steps—which includes two rounds of balance sheet expansion or quantitative easing (QE), two phases of the portfolio reshuffling known as “Operation Twist,” and two extensions of its guidance about when rate increases might begin—looks likely to continue at the September 12 FOMC meeting. Minutes from the July 31/ August 1 meeting released this week noted that many Fed officials thought “additional monetary accommodation would likely be warranted fairly soon unless incoming information pointed to a substantial and sustainable strengthening in the pace of the economic recovery.” Although the incoming dataflow has brightened somewhat since the time of the meeting, the scattered improvements seen so far are unlikely to meet the relatively high threshold of a “substantial and sustainable strengthening.” Thus, absent major surprises in the data or financial conditions, more easing at the next meeting appears likely.
How exactly the Fed might ease remains an open question. At the very least we would expect another extension of the committee’s “forward guidance” about the funds rate. Indeed, the minutes indicated that Fed officials were already very close to extending the guidance at the last meeting, noting that “many members expressed support for extending the Committee’s forward guidance, but they agreed to defer such a decision on this matter until the September meeting,” when committee members will officially update their economic projections. Currently the post-meeting statement says that economic conditions are likely to warrant exceptionally low interest rates “at least through late 2014.” We look for the FOMC to extend this guidance to “at least mid2015” at the next meeting.
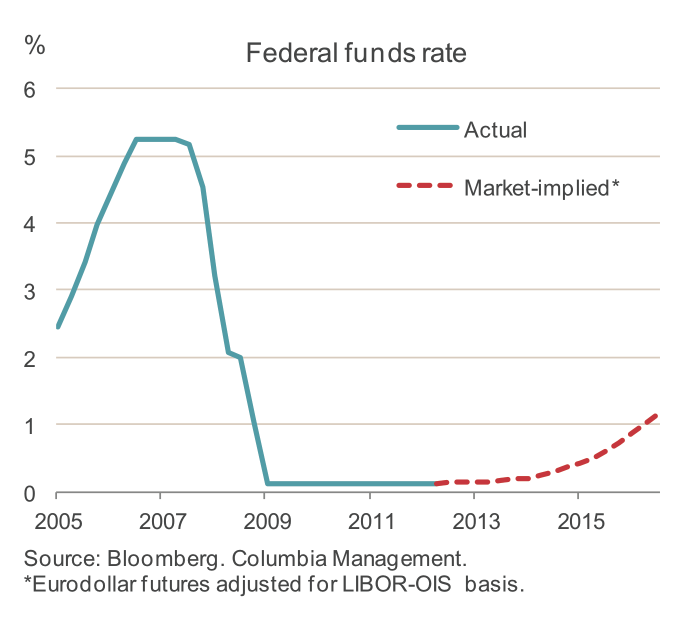
Although an important step, this action would not come as much surprise to the bond market: money markets are already pricing in a mid-2015 start to rate hikes (see exhibit).
Asset purchases are a closer call. The minutes showed that the committee discussed this option as well, including implementation details such as the way to structure a program (e.g. a target stock or a month-to-month flow) and the capacity for additional purchases in the Treasury and agency mortgage-backed security (MBS) markets. Fed officials mostly appeared optimistic about the potential benefits of the program: Many argued additional purchase would ease financial conditions and support the recovery and some added that QE could boost business and consumer confidence. At the same time, earlier rounds of QE were generally announced following major deteriorations in financial conditions, and they have not previously coincided with changes to forward guidance.
Politics may also argue for inaction: QE has proven to be somewhat controversial and the meeting comes just prior to the presidential election.
Although it is not a done deal, we see an announcement of another round of asset purchases at the September meeting as more likely than not. A deterioration in financial conditions and/or disappointing labor market data would make QE more clearly the central case. Alternatively, much better than expected economic data could take QE off the table for now. We continue to expect any new asset purchase program to be concentrated in the mortgage market.
*****
Drought and Doubt
by Brian Aronson, Albert Copersino, Paul DiGiacomo, Josh Kapp, Catherine Nelson
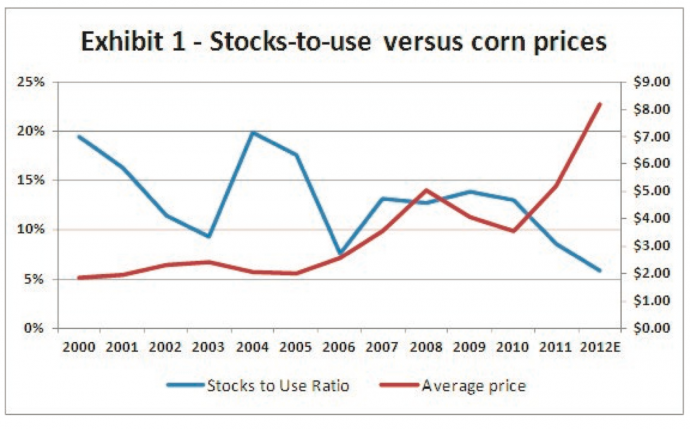
Earlier this month, the U.S. Department of Agriculture slashed its forecasts for the 2012/2013 corn harvest. As a result of widespread drought, the agency now expects a 13% decline in production versus an expectation for a 5% increase just one month ago. Consequently, corn prices have skyrocketed (Exhibit 1). Interestingly, the effect of the anemic harvest touches many segments of the economy:
Food: Crop users, particularly chicken processors, will endure much of the burden of this year’s production shortfall through sharply higherpriced feed. Also, higher prices for ingredients, such as vegetable oil and corn sweeteners, will pressure margins for food and beverage manufacturers if not recovered in pricing. While many companies are hedged through 2012, meaningful ingredient cost inflation will likely limit profit growth in 2013.
Farming: With grain prices at record levels, farmers will book strong profits, supporting the best three-year period in U.S. history. Favorable farm income is generally positive for seed and fertilizer demand, but uncertainty, whether on future ethanol policy or crop insurance receipts, has made farmers cautious and high grain prices have not yet translated into robust demand and pricing for farm inputs.
Transportation: Since corn is 5%-7% of shipments, a weak harvest will hurt railroad volume. But, the hot weather has created greater demand for air conditioning and coal -fired power, which has suffered from the shift to cheaper natural gas, is recovering. In addition, low water levels are reducing barge traffic along inland waterways and shippers are diverting grain to the rails, which will moderate the decline.
Machinery: Demand for tractors and combines is highly correlated with farmer cash receipts. Before the drought, investors questioned whether farmers would continue to upgrade equipment after several years of strong demand. But, high grain prices and low
stocks should help extend the bull cycle for agriculture equipment.
Insurance: The drought will generate industry losses, but the best-positioned insurers have kept the crop business to a small portion of their overall book. Also, underwriting skill is critical: the mix of states to operate in, the crops to underwrite and the risks to cede to reinsurers drive profitability. Going forward, the government, which currently reimburses farmers and insurers for some costs, may cut its subsidies and make the program less attractive.
Ultimately, if shortages persist, the end consumer will shoulder the burden of higher prices. But, favorable weather, adequate fertilizer and better seeds could fuel a bumper crop next year and reverse many of the trends experienced today.
*****
Revisiting Recession Indicators
by Marie Schofield, Chief Economist
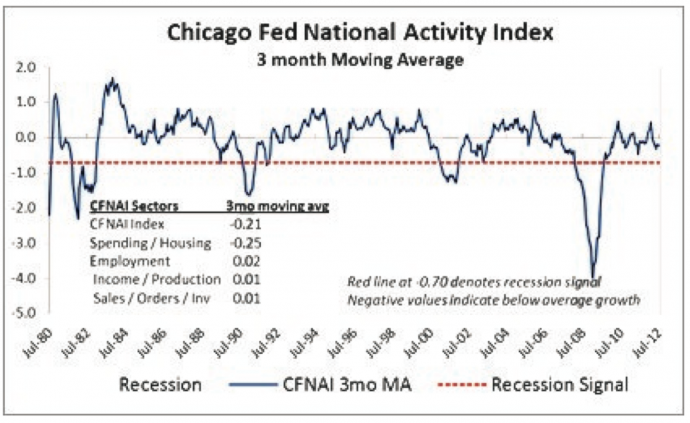
Data reads in the last few weeks have stabilized but on balance remain weak. There are a number of indicators we review to gauge underlying trend changes in aggregate economic activity and monitor if recession risks are rising. The Chicago Fed National Activity Index (CFNAI) is closely followed as more of a coincident indicator for overall economic activity. The index is a weighted average of 85 national indicators drawn from four broad data categories: 1) production and income, 2) labor markets, 3) consumption and housing and 4) sales, orders and inventories. Negative values indicate economic growth is below trend, zero at trend and positive values above trend.
Importantly, the three-month moving average of the index (CFNAI-MA3) has correctly forecasted recession when falling below — 0.7 based on history. The July reading fell slightly to -0.21 suggesting a continuation of below-trend growth but was also its fifth consecutive reading below zero. The housing component continues to exert a notable drag with other sectors seeing only faint increases. Labor market and production gains have slowed now with sales/orders improving a touch. While the revisions to past data here are notorious, current levels remain near those seen last summer and imply the recovery plods on at a slow pace.
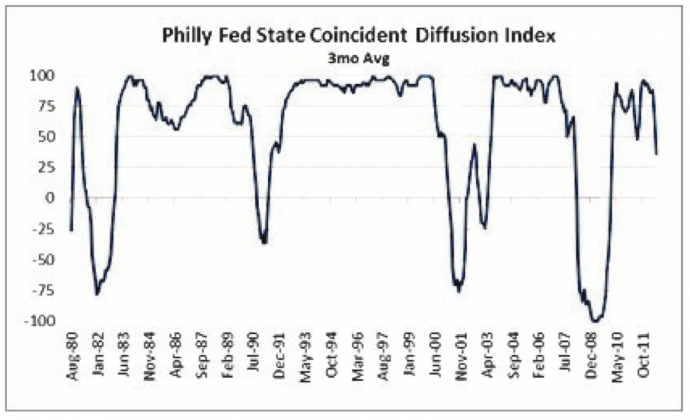
Another series is the Philadelphia Fed State Coincident Indexes. This monitors economic activity on a state-by-state level, comparing the number of states with increasing activity versus those where activity is falling and conditions are more recessionary.
Fourteen states are seeing falling activity now with rising activity in 32 (and four unchanged). The overall diffusion index for July came in at 36 (dropping 15 points), which is the third largest decline on record and the weakest reading since 2010 in the post-recession period. Readings below 25 have been associated with recessionary periods, so the index is getting uncomfortably close to this flag. Directionally, growth appears to be slowing with many states barely positive. This is a more cautionary signal for policymakers in that they confirm the recovery has lost some steam over the past few months.
While these are not perfect measures as recession indicators and they are frequently revised, these indexes do confirm the loss of economic momentum, the heightened concern of the Fed regarding the miss on growth objectives, and the need for more policy accommodation.
*****
Automation in Asia
by Daisuke Nomoto
We believe automation in Asia is one of the most promising long-term investment themes. Automation can be defined as the use of control systems to reduce the need for human work in the production of goods and services.
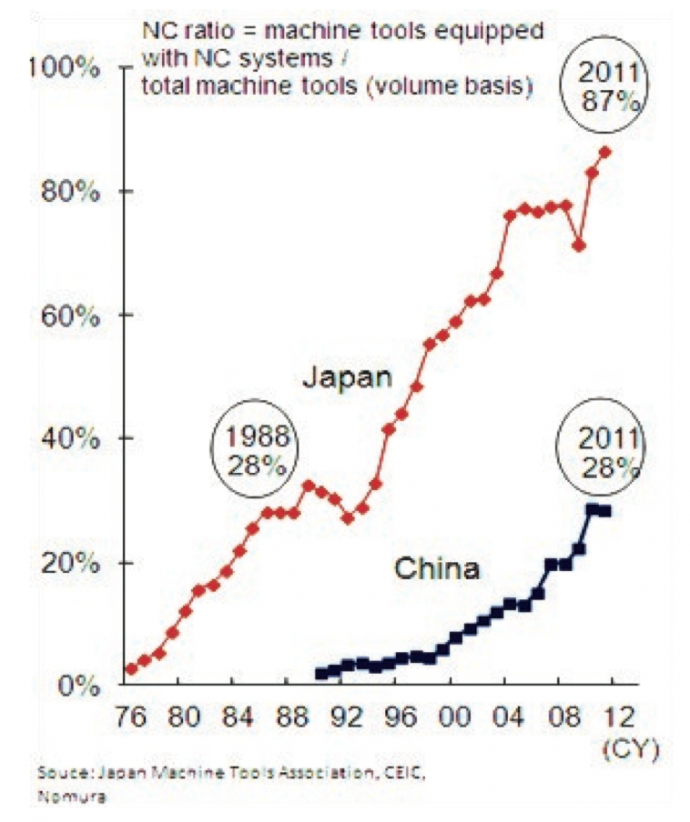
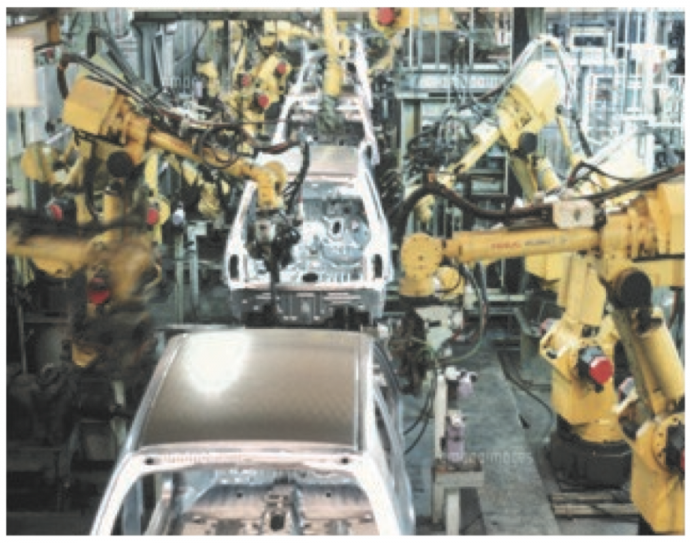
What’s driving automation demand is not only the need for manufacturing standardized quality products, but also higher raw material and wage costs. For example, the average Chinese wage has increased at a 15% Compound Annual Growth Rate over the last 15 years and Thailand’s minimum wage was recently raised by about 30% to approximately $10 a day (in U.S. dollars). With more jobs becoming available in China’s inland regions, we see a shortage of skilled labor in coastal regions, which exacerbates the upward pressure on personnel costs. As indicated in the graph, the ratio of numerical control (NC)* equipment to total machine tools in China was 28% in 2011, the same level as Japan’s in 1988. Also, the penetration rate for welding robots used in automobile production in China is less than half the level of Japan and Germany. The wave of automation is not a China specific trend, but has considerable scope to spread to other emerging Asian countries where wages are structurally rising. The Japan Robot Association (JARA) expects the industrial robot market to become 1.5x larger in 2020 and 3x in 2035 relative to today. The International Federation of Robotics (IFR) forecasts Asia to account for about 60% of the robot market globally up from 45% for 2001, while Europe’s share fell to 24% from 40% in 2001 and the Americas only account for 15% of the total market at the moment.
*Numerical control (NC) refers to the automation of machine tools that are operated by abstractly programmed commands en-controlled manually via hand wheels or levers, or mechanically automated via cams alone.
There is little doubt that industrial automation will continue to play an important role for standardized processing, wage cost management and the line-by-line productivity improvement in factories. So what does the future of industrial automation look like? We think service robots would be the next generation paradigm once the applications that they can be used for expand. JARA expects the service robot market in 2035 to be 40x greater than today. Its market size is estimated to surpass that of industrial robots around 2020~2025, and to be doubled the size of the industrial robot market by around 2035.
In a broader sense, automation is not limited to manufacturing solely, but potentially impacts many aspects of our daily lives such as home security, tele-monitoring, nursing care support, domestic help, etc. We believe that the industrial robot supply chain will continue to see consistent demand growth over the next several years, with the next investment opportunities would likely be occurring in the service robot supply chain.
Service robots assist human beings, typically by performing a job that is dirty, dull, distant, dangerous or repetitive, including household chores. They typically are autonomous and/or operated by a built in control system, with manual override options.
Disclaimer
The views expressed are as of the date given, may change as market or other conditions change, and may differ from views expressed by other Columbia Management Investment Advisers, LLC (CMIA) associates or affiliates. Actual investments or investment decisions made by CMIA and its affiliates, whether for its own account or on behalf of clients, will not necessarily reflect the views expressed. This information is not intended to provide investment advice and does not account for individual investor circumstances. Investment decisions should always be made based on an investor's specific financial needs, objectives, goals, time horizon, and risk tolerance. Asset classes described may not be suitable for all investors. Past performance does not guarantee future results and no forecast should be considered a guarantee either. Since economic and market conditions change frequently, there can be no assurance that the trends described here will continue or that the forecasts are accurate.
Copyright © Columbia Management


