Upcoming US Events for Today:
- Chicago PMI for August will be released at 9:45am. The market expects 53.0 versus 53.7 previous.
- Consumer Sentiment for August will be released at 9:55am. The market expects 73.5 versus 73.6 previous.
- Factory Orders for July will be released at 10:00am. The market expects an increase of 2.0% versus a decline of 0.5% previous.
- Ben Bernanke Speaks at 10:00am.
Upcoming International Events for Today:
- German Retail Sales for July will be released at 2:00am EST. The market expects a month-over-month increase of 0.3% versus a decline of 0.1% previous.
- Euro-Zone Consumer Price Index Flash will be released at 5:00am EST. The market expects 2.5% versus 2.4% previous.
- Canadian GDP for the Second Quarter will be released at 8:30am. The market expects 1.6% versus 1.9% previous.
- China Manufacturing PMI will be released at 9:00pm EST. The market expects 50.1, unchanged from the previous report.
Recap of Yesterday’s Economic Events:
| Event | Actual | Forecast | Previous |
| EUR German Unemployment Change | 9K | 7K | 9K |
| EUR German Unemployment Rate s.a. | 6.80% | 6.80% | 6.80% |
| EUR Euro-Zone Business Climate Indicator | -1.21 | -1.3 | -1.27 |
| EUR Euro-Zone Consumer Confidence | -24.6 | -24.6 | -24.6 |
| EUR Euro-Zone Economic Confidence | 86.1 | 87.5 | 87.9 |
| EUR Euro-Zone Industrial Confidence | -15.3 | -15.5 | -15.1 |
| EUR Euro-Zone Services Confidence | -10.8 | -9 | -8.5 |
| EUR Italian Business Confidence (AUG) | 87.2 | 86.8 | 87.1 |
| CAD Current Account (BoP) (Canadian dollar) | -$16.0B | -$15.0B | -$10.3B |
| USD Personal Income | 0.30% | 0.30% | 0.30% |
| USD Personal Spending | 0.40% | 0.50% | 0.00% |
| USD Personal Consumption Expenditure Deflator (MoM) | 0.00% | 0.10% | 0.10% |
| USD Personal Consumption Expenditure Deflator (YoY) | 1.60% | 1.40% | 1.50% |
| USD Personal Consumption Expenditure Core (MoM) | 0.00% | 0.10% | 0.20% |
| USD Personal Consumption Expenditure Core (YoY) | 1.60% | 1.70% | 1.80% |
| USD Continuing Claims | 3316K | 3307K | 3321K |
| USD Initial Jobless Claims | 374K | 370K | 374K |
| GBP GfK Consumer Confidence Survey | -29 | -27 | -29 |
| JPY Nomura/JMMA Manufacturing Purchasing Manager Index | 47.7 | 47.9 | |
| JPY Household Spending (YoY) | 1.70% | 1.20% | 1.60% |
| JPY National Consumer Price Index Ex-Fresh Food (YoY) | -0.30% | -0.30% | -0.20% |
| JPY National Consumer Price Index Ex Food, Energy (YoY) | -0.60% | -0.60% | -0.60% |
| JPY Tokyo Consumer Price Index (YoY) | -0.70% | -0.70% | -0.80% |
| JPY Tokyo Consumer Price Index Ex-Fresh Food (YoY) | -0.50% | -0.60% | -0.60% |
| JPY Tokyo Consumer Price Index Ex Food, Energy (YoY) | -0.80% | -1.00% | -1.00% |
| JPY Jobless Rate | 4.30% | 4.30% | 4.30% |
| JPY National Consumer Price Index (YoY) | -0.40% | -0.30% | -0.20% |
| JPY Industrial Production (MoM) | -1.20% | 1.70% | 0.40% |
| JPY Industrial Production (YoY) | -1.00% | 1.80% | -1.50% |
The Markets
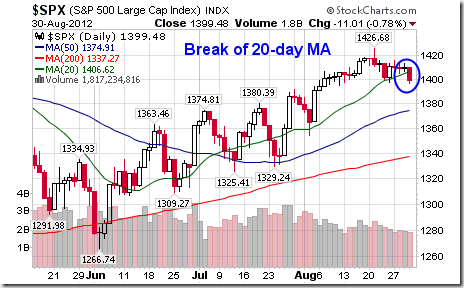
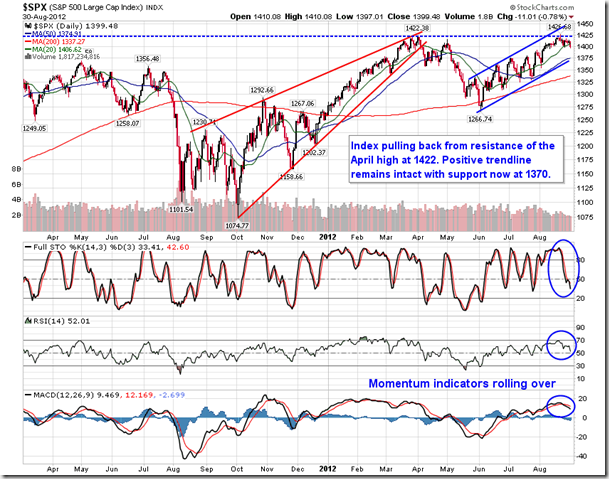
Well the long awaited day is finally here. Today Ben Bernanke will make his speech at Jackson Hole, the spot where hints of past QE programs have been delivered. Equity investors trimmed some market exposure on Thursday prior to the event, pushing the S&P 500 and other major equity benchmarks below 20-day moving averages. This is the first close for the major averages below the 20-day moving average since the end of July, precisely when ECB President Mario Draghi talked up the Euro, fueling the rally in stocks over the past six weeks. The Dow Jones Industrial Average cracked the psychologically important 13,000 level while the S&P cracked and closed marginally below 1400. The waiting game is over with the Ben Bernanke speaking today and the ECB meeting next week, two key events that will either make or break this rally derived from speculation that central banks will inject further stimulus into the economy. Thoughts were offered in Wednesday’s report on whether or not these key market makers/manipulators will offer something in the days to come.
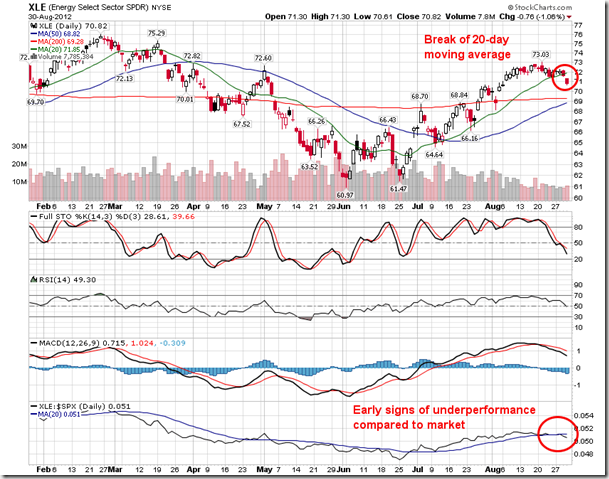
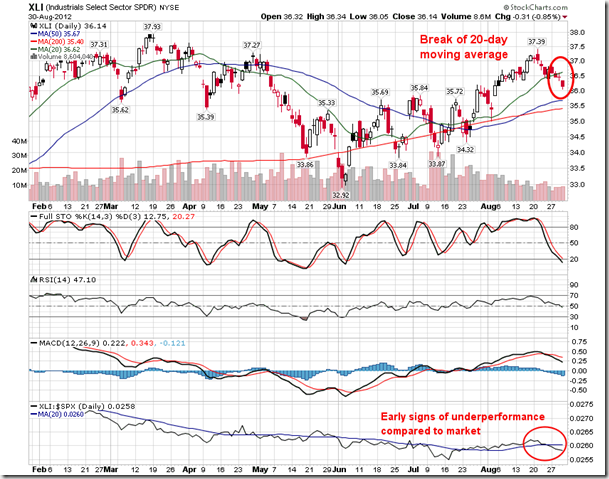
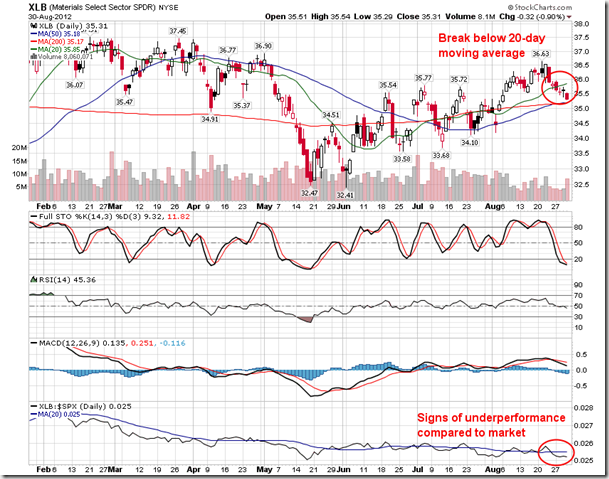
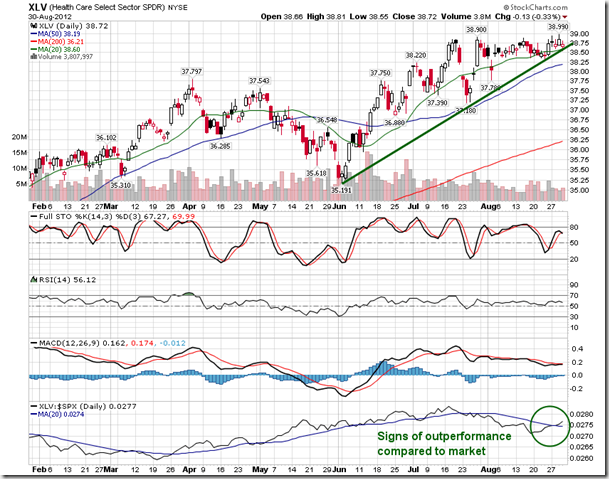
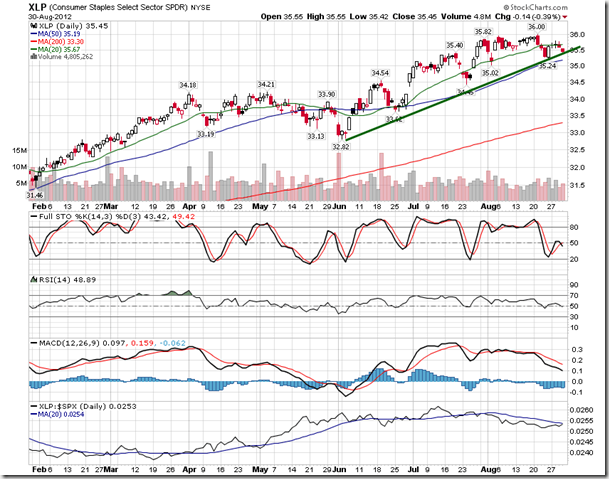
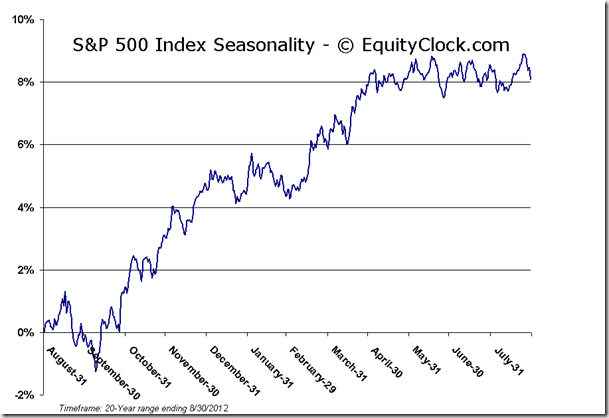
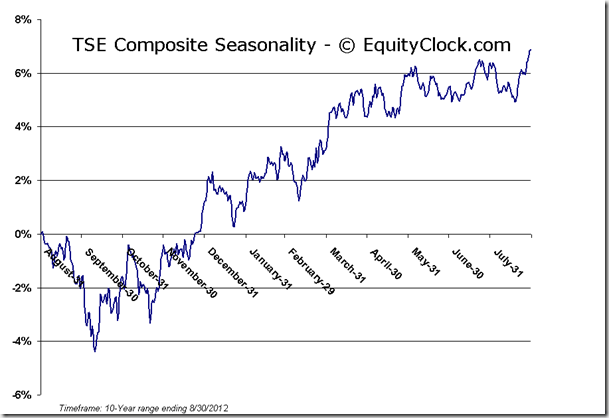
With 20-day moving averages now breached across many equity benchmarks, the implication is that the market has now fallen under short-term weakness. This weakness is also becoming evident in the sector activity as key cyclical sectors, such as energy, industrials, and materials, start to roll over and underperform market benchmarks, while defensives, mainly staples and healthcare, maintain positive trends and start to outperform once again. Although not definitive, a gradual shift from risk-on to risk-off appears to be underway. Keep in mind that this could shift abruptly depending on what is revealed at the upcoming central bank events as we enter the month of September. September into October is seasonally the key risk-off period for the market when Consumer Discretionary, Materials, and Industrials drive the market lower. Volatility typically flourishes over this period, which has been known to benefit Gold. Overall, however, few sectors/industries are immune from losses between now and October, from a seasonal perspective, implying that, in absence of any central bank market manipulation, equities are likely to correct lower in the near-term.
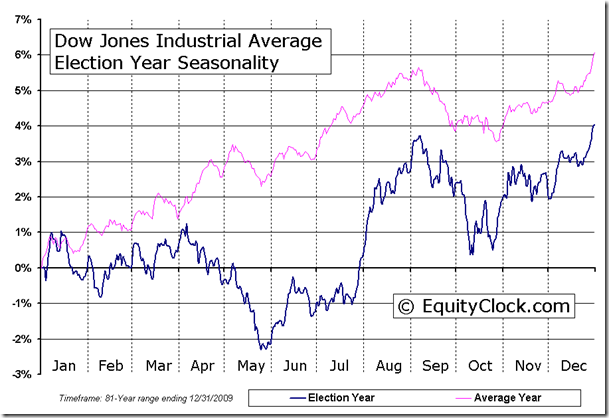
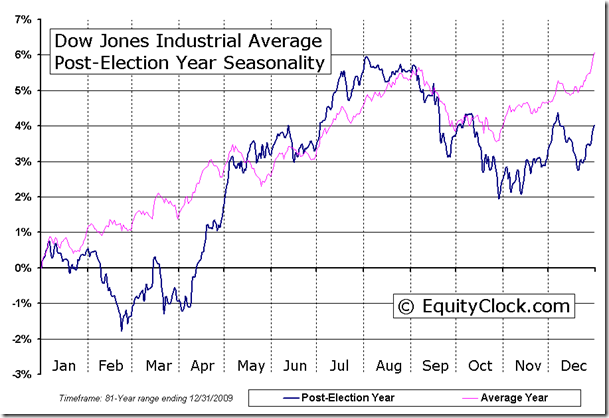
Turning to the average tendencies during election years, the negative trend during the month of September and into October typically concludes prior to the election when equities spike in anticipation of a favored outcome. November is then typically flat, followed by a strong month of December, which leads into the Post-Election year. The year following the election tends to be a bit sluggish during the first quarter as the new Presidential term begins. A number of analysts are speculating that equity markets may be fine up until the end of this year with trouble to be felt into 2013. In many ways, the seasonal tendencies for the four-year cycle support this argument with negative first quarter returns and below average results over the entire year typical during these post election periods. We may be in store for a roller coaster ride over the next six months.
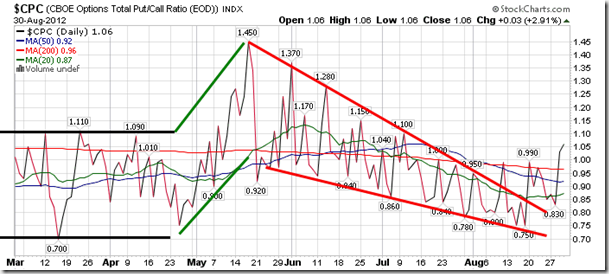
Sentiment on Thursday, as gauged by the put-call ratio, ended bearish at 1.06. The ratio is moving definitively above its falling wedge pattern and the trend is now higher, typically a bearish trend for equity markets. One thing that is optimistic is the fact that previous signs of complacency have alleviated, which is a very good sign going into the upcoming uncertain events.
Chart Courtesy of StockCharts.com
Chart Courtesy of StockCharts.com
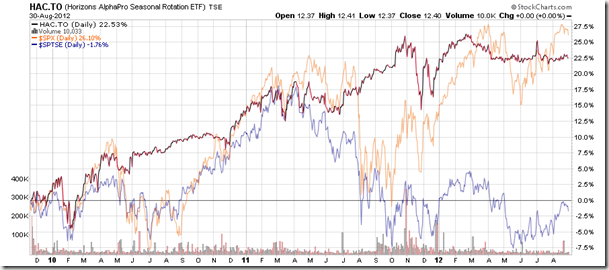
Horizons Seasonal Rotation ETF (TSX:HAC)
- Closing Market Value: $12.40 (unchanged)
- Closing NAV/Unit: $12.40 (down 0.18%)
Performance*
| 2012 Year-to-Date | Since Inception (Nov 19, 2009) | |
| HAC.TO | 1.81% | 24.0% |
* performance calculated on Closing NAV/Unit as provided by custodian
Click Here to learn more about the proprietary, seasonal rotation investment strategy developed by research analysts Don Vialoux, Brooke Thackray, and Jon Vialoux.


