by Don Vialoux, EquityClock.com
Upcoming US Economic Events for Today:
- Weekly Jobless Claims will be released at 8:30am. The market expects Initial Claims to show 365K versus 366K previous. Continuing Claims are expected to reveal 3298K versus 3305K previous.
- Flash PMI Manufacturing Index for August will be released at 9:00am. The market expects 51.0 versus 51.8 previous.
- The FHFA Housing Price Index for June will be released at 10:00am. The market expects an increase of 0.6% versus 0.8% previous.
- New Home Sales for July will be released at 10:00am. The market expects 362K versus 350K previous.
Upcoming International Events for Today:
- German GDP for the Second Quarter will be released at 2:00am EST. The market expects a year-over-year increase of 1.0% versus an increase of 1.2% previous.
- German Flash PMI Manufacturing Index for August will be released at 3:30am EST. The market expects 43.6 versus 43.3 previous. Flash PMI Services is expected to show 50.2 versus 49.7 previous.
- Euro-Zone Flash PMI Manufacturing for August will be released at 4:00am EST. The market expects 44.3 versus 44.1 previous. Flash PMI Services is expected to show 47.9 versus 47.6 previous.
The Markets
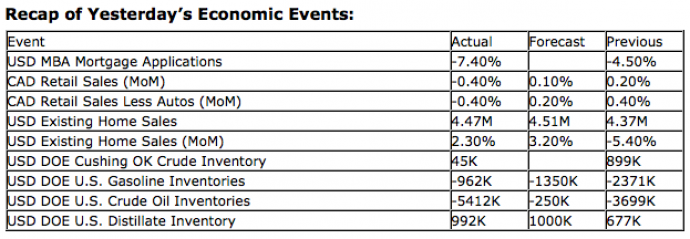
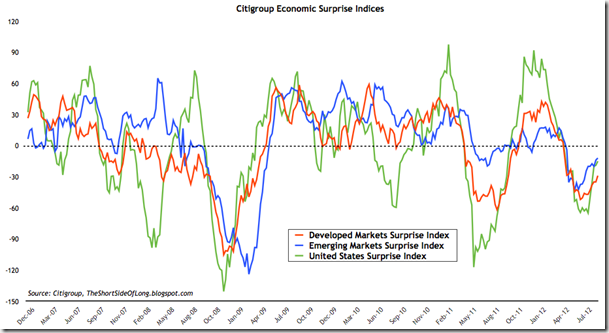
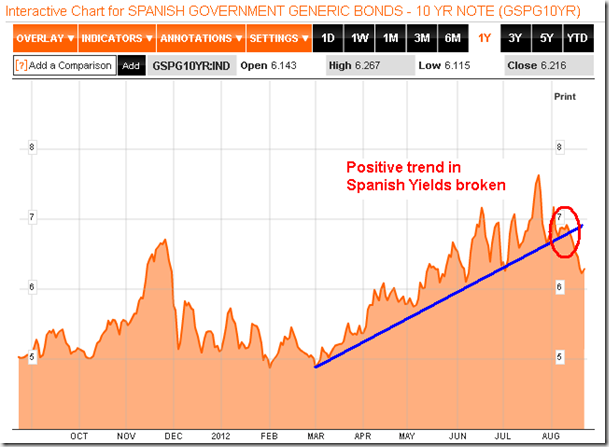
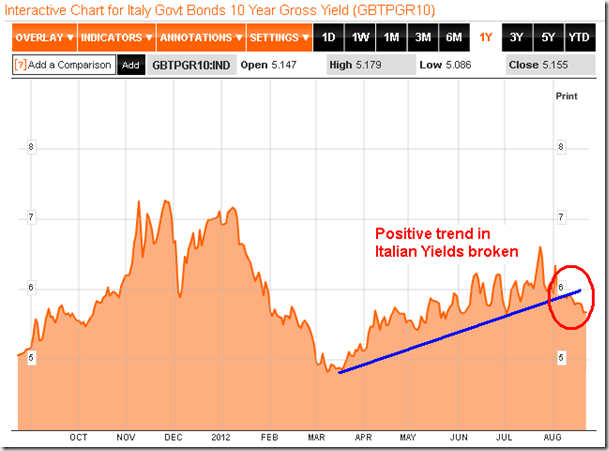
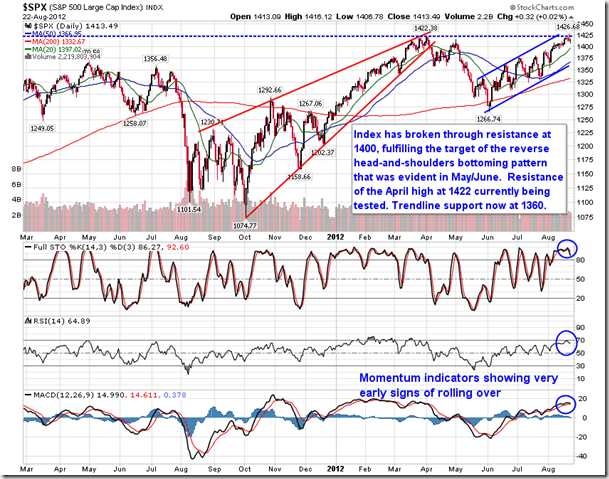
Markets ended around the flat-line on Wednesday as early morning losses were erased following the release of the latest FOMC minutes, which indicated an increased probability for further monetary stimulus in the near future. The minutes indicated that “many members judged that additional monetary accommodation would likely be warranted fairly soon unless incoming information pointed to a substantial and sustainable strengthening in the pace of the economic recovery.” Economic data released since the meeting has already shown considerable improvement over prior releases, including that pertaining to employment and retail sales. Even the Citigroup Economic Surprise Index, which measures the miss/beat rate of actual economic results compared to expectations, has been improving, suggesting that expectations have become much more realistic and current market prices properly reflect the struggling state of economic momentum. And the debt concerns in Europe have seemingly stabilized, for now, with yields in Spain and Italy breaking recent up-trends that were setting the stage for a potential collapse in the Euro. With these new revelations, further QE from the Fed is all but a foregone conclusion, implying that further stimulus might not be received as soon as what investors are anticipating. The upcoming election in the US may deter any action until next year when issues with the fiscal cliff are resolved and certainty, whether positive or negative, returns to the market. Buckle up for a wild ride into the end of this year.
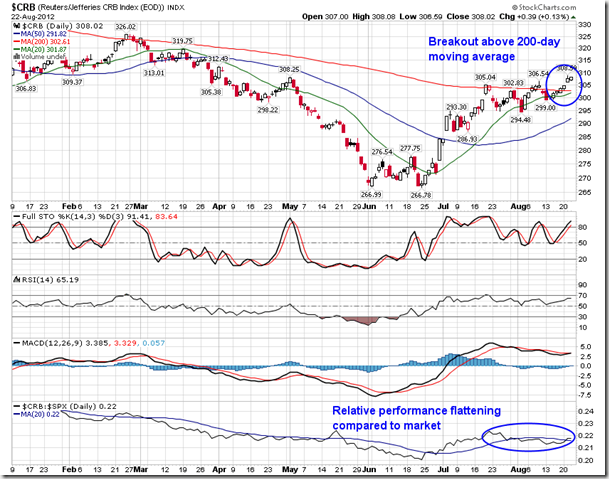
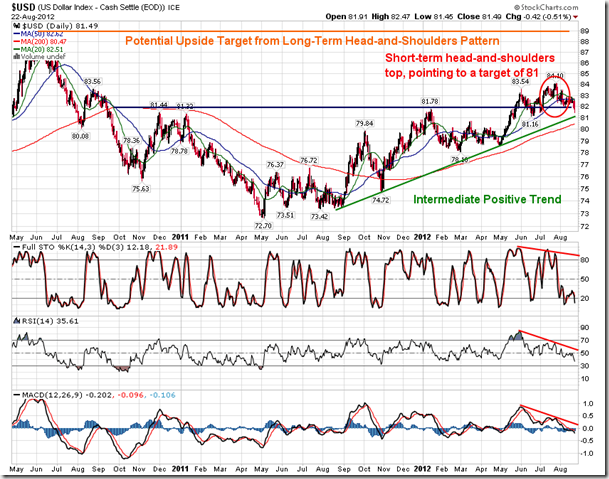
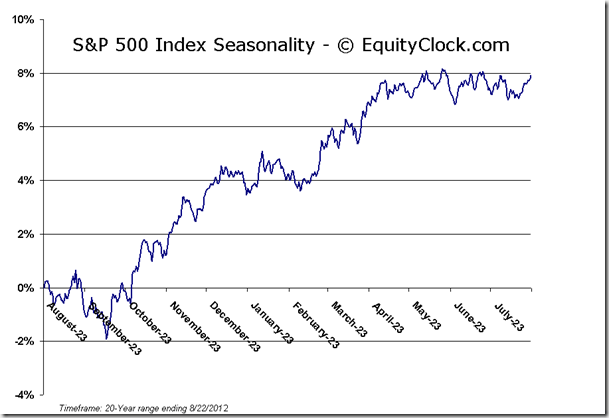
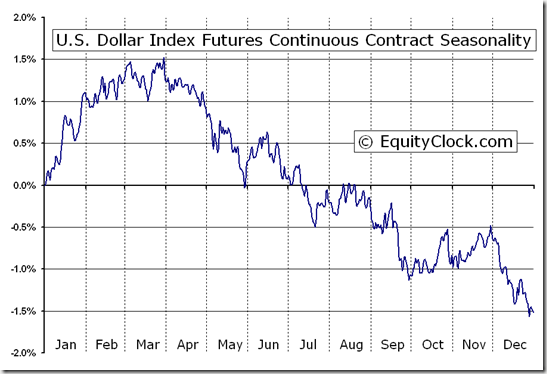
With the Fed’s suggestion of further monetary easing, commodities rallied, breaking firmly above the 200-day moving average, according to the CRB Commodity Index. And while commodities rallied, the US Dollar Index plunged, coming close to achieving the target suggested by the short-term head-and-shoulders top of 81. This bearish setup for the US Dollar was pointed out on this site at the beginning of the week, however, thoughts were that the move would play out over a matter of weeks rather than days. With the US Dollar nearing that downside target, the long-term rising trend-line could soon be tested, potentially offering a hindrance to this commodity rally. Despite the significant dollar decline over the past two sessions, equity markets have failed to move higher, hinting of equity market exhaustion at current overbought levels. The US Dollar Index remains seasonally negative through September before stabilizing into October and November.
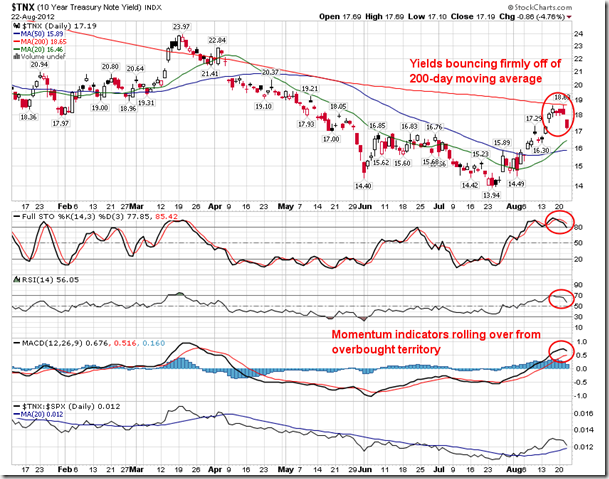
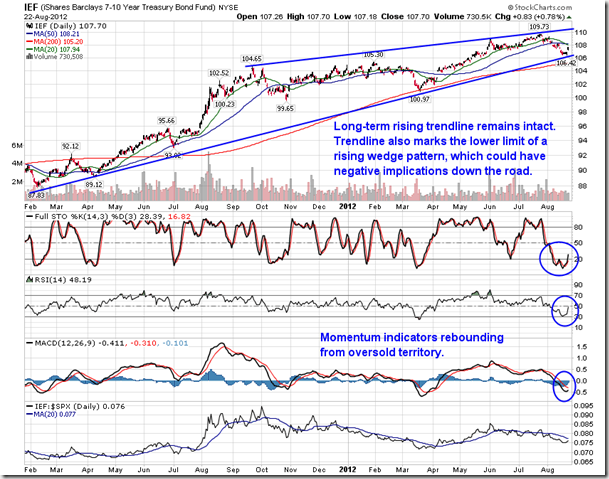
Currencies and commodities weren’t the only asset classes to move following the Fed minutes. Bond yields fell in what was the largest move lower since May. The ten year yield bounced firmly off of its 200-day moving average, rolling over from overbought territory. Bond prices, according to the 7-10 Year Treasury Bond ETF (IEF), rebounded from oversold territory. The Bond ETF is maintaining a long-term positive trendline that dates back to the start of 2011. However, struggle may become apparent down the road as the positive trendline also marks the lower limit of a rising wedge pattern, which could imply significant negative potential upon breakdown below the pattern. A breakdown in the bond market would likely translate into equity market strength as funds flow from one asset to another.
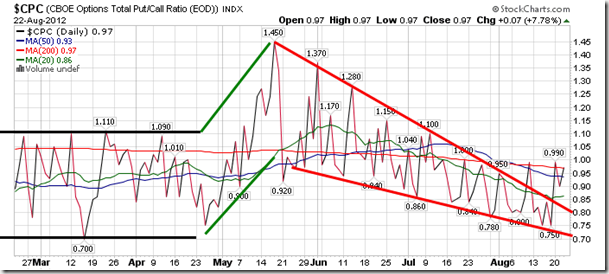
Sentiment on Wednesday, as gauged by the put-call ratio, ended close to neutral at 0.97. The ratio has recently broken out of a falling wedge pattern, suggesting a change of trend from bullish to neutral/bearish may be becoming realized.
Chart Courtesy of StockCharts.com
Chart Courtesy of StockCharts.com
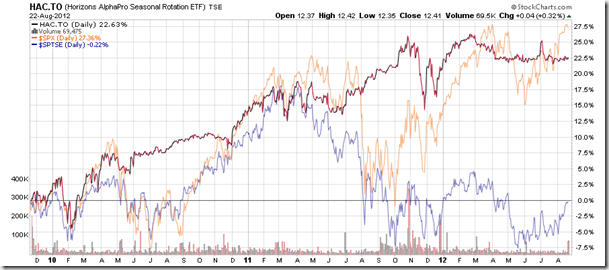
Horizons Seasonal Rotation ETF (TSX:HAC)
- Closing Market Value: $12.41 (up 0.32%)
- Closing NAV/Unit: $12.43 (up 0.32%)
Performance*
| 2012 Year-to-Date | Since Inception (Nov 19, 2009) | |
| HAC.TO | 2.07% | 24.3% |
* performance calculated on Closing NAV/Unit as provided by custodian
Click Here to learn more about the proprietary, seasonal rotation investment strategy developed by research analysts Don Vialoux, Brooke Thackray, and Jon Vialoux.
Copyright © Timingthemarket.ca


