by Don Vialoux, EquityClock.com
Upcoming US Events for Today:
- The Fed Releases Minutes from August 1 FOMC Meeting at 2:00pm.
Upcoming International Events for Today:
- Japanese Merchandise Trade Balance for July will be released at 7:50pm.
Recap of Yesterday’s Economic Events:
The Markets
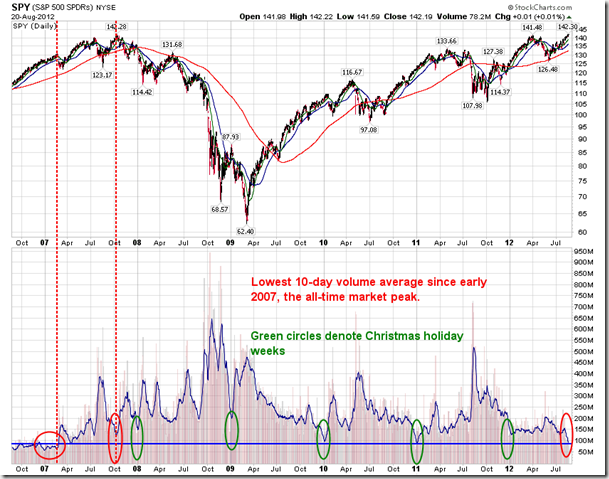
Markets traded flat on Monday as little news was offered in the US or Europe to move the needle in either direction. Volume remains light as conviction appears seemingly absent while complacency flourishes. Average volume stats continue to amaze. The 10-day average volume for the S&P 500 ETF (SPY) is at the lowest level since early 2007, just prior to the all-time market peak. This two week volume average even rivals that of subdued Christmas holiday periods, in which shortened trading days and quiet trading desks are the norm. Volumes typically decline during the summer months, however, recent volumes are well below seasonal averages, implying that investors are choosing to stand aside from the recent market gains. Volumes significantly petered off following the last ECB meeting in which no new stimulus was offered after much hype and anticipation pertaining to such an event. Volumes are likely not to return in full force until we reach September, when traders customarily return to their desks from summer vacation.
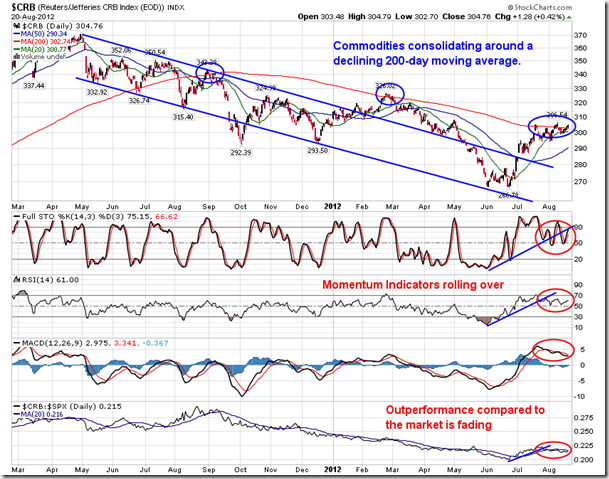
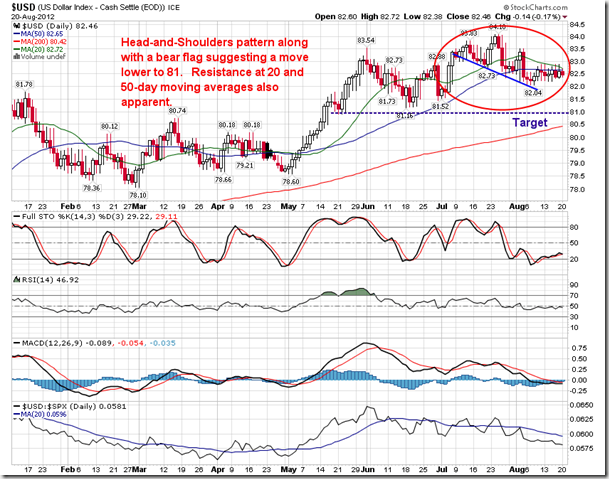
Commodities are once again at a pivotal point. The CRB Commodity index is consolidating around its 200-day moving average, a situation that has occurred twice before over the past year prior to turning lower. However, as mentioned in yesterday’s report, an interesting pattern is setting up in the US Dollar index that could be conducive to further gains in commodities. The US Dollar Index is showing a short-term head-and-shoulders topping pattern combined with a bear flag, each of which point to a target of 81, or a decline of approximately 1.75% from Monday’s close. A weaker domestic currency would strengthen the price of commodities based in USD. A definitive breakout in the CRB commodity index above its 200-day moving average would be the first time this index has traded firmly above this long-term average since the first half of 2011.
A quick technical rundown of the key commodities can be found below:
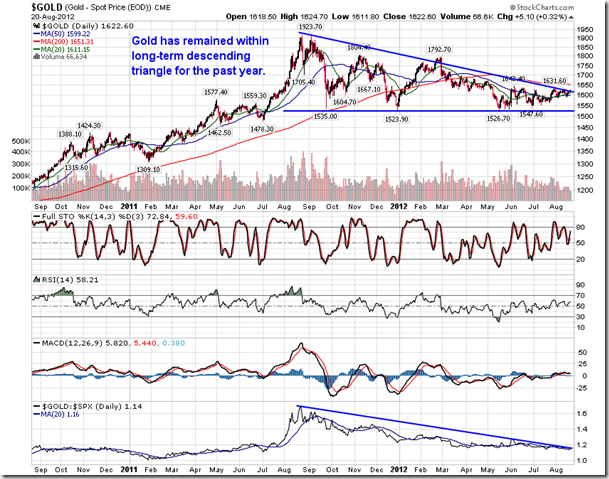
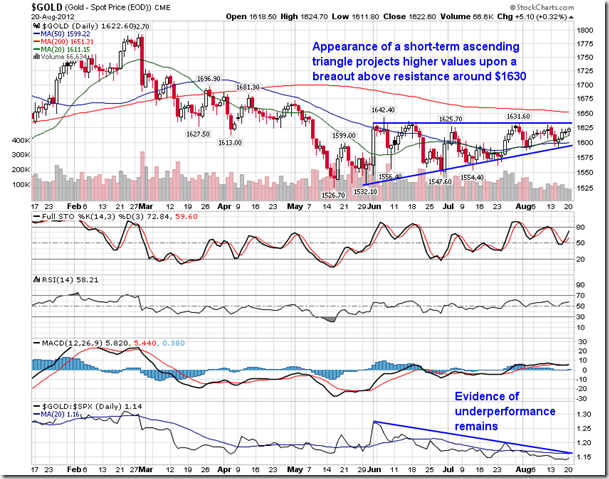
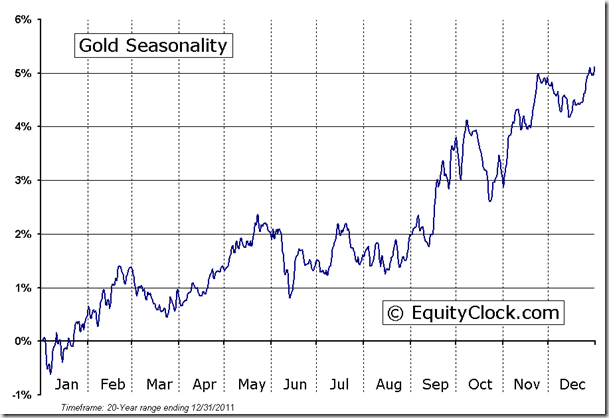
Gold is presently within a period of seasonal strength that stretches through to the beginning of October. The commodity has been within a long-term descending triangle for the past year, underperforming the market in the process. However, recently the price of Gold has been consolidating within an opposing short-term pattern, an ascending triangle, which could propel the commodity higher through to the end of the period of seasonal strength in October. Gold stocks have been significantly outperforming the metal as investors place bets that the price of bullion will push higher, benefitting the miners.
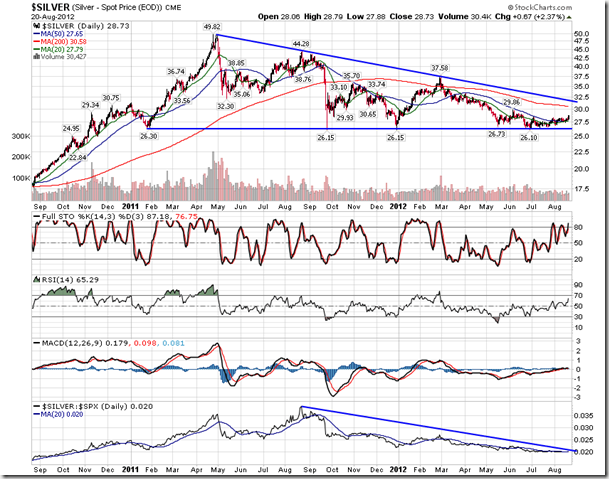
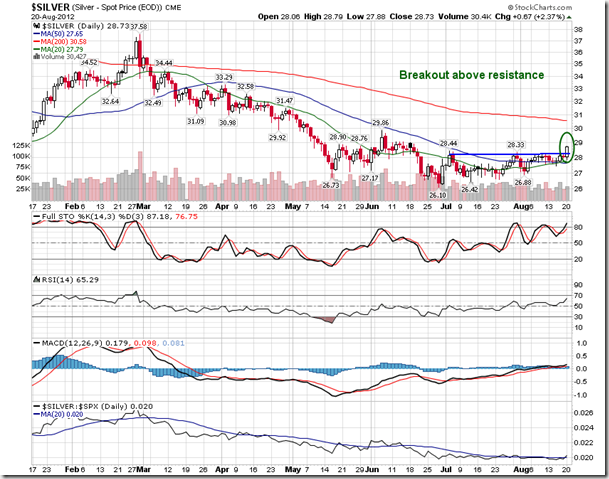
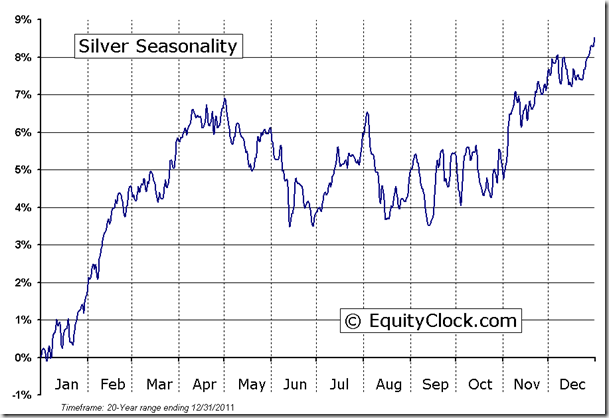
Silver, similar to Gold, has been trading within a long-term descending triangle pattern, also underperforming the market over the course of the year. However, just yesterday the commodity broke out of a short-term consolidation range, possibly taking a run at the upper limit of the long-term descending triangle that sits almost 10% higher than present levels. Silver is seasonally neutral between now and November.
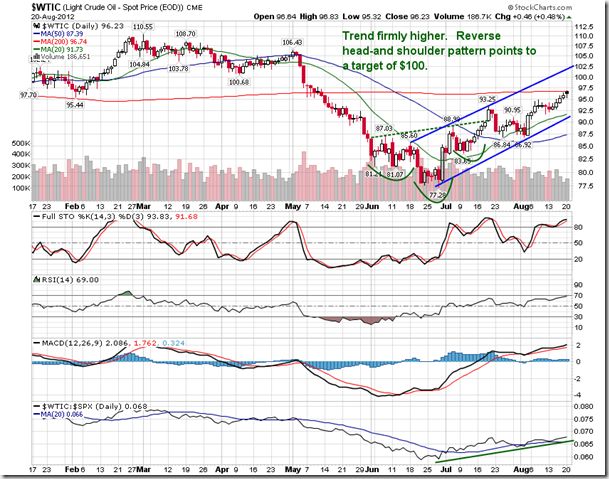
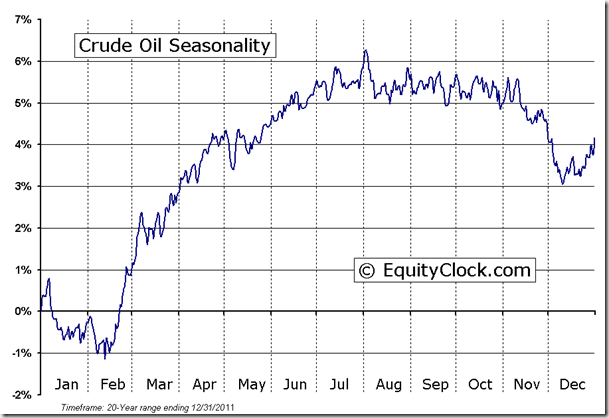
Oil is presently testing its 200-day moving average, similar to the CRB Commodity Index. The commodity has been outperforming the market since its lows set back in June and is now reaching overbought territory. A reverse head-and-shoulders bottoming pattern that was completed in June and July points to an upside target of $100. Crude Oil is reaching the latter stages of its positive summer seasonal trend that typically peaks out in September/October.
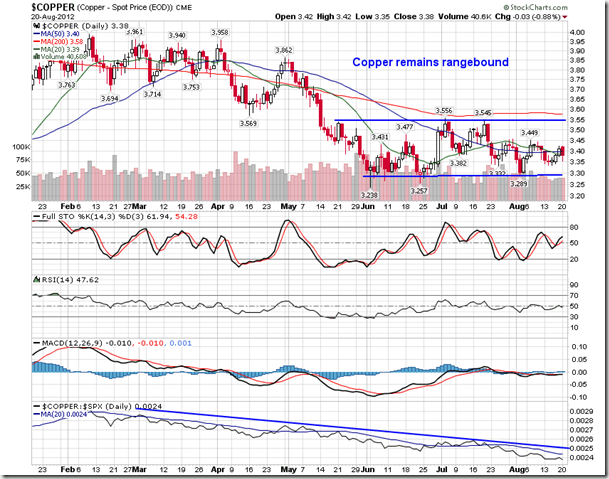
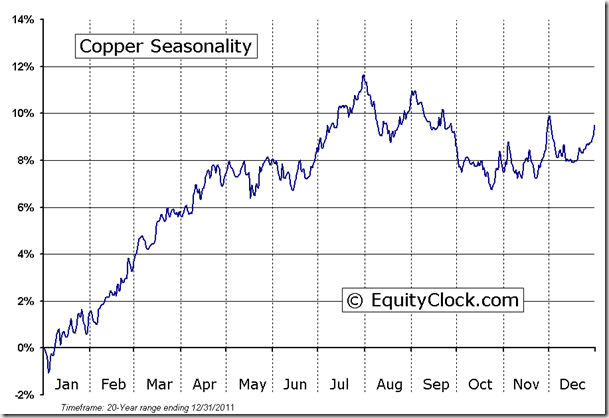
And, finally, Copper has been the lackluster commodity of the group. Often looked to as a gauge of economic strength, copper has been lagging the market and has failed to gain any significant momentum over the past three months. The metal has been consolidating around its 50-day moving average, now at 3.40, an average that may be showing early signs of curling higher. Underperformance compared to the market remains significant and recent struggling manufacturing reports do not profile an optimistic picture for the metal. Copper is presently within a period of seasonal weakness that runs through to November.
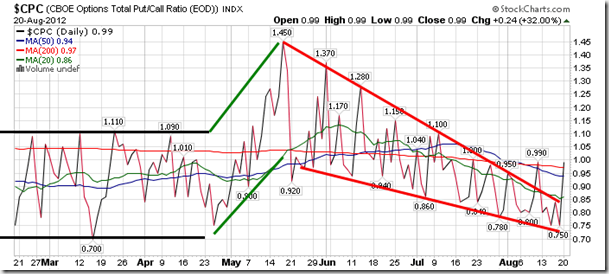
Sentiment on Monday, as gauged by the put-call ratio, ended neutral at 0.99.
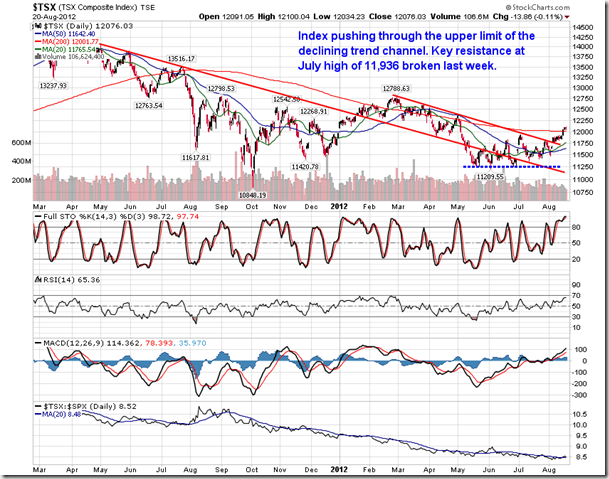
Chart Courtesy of StockCharts.com
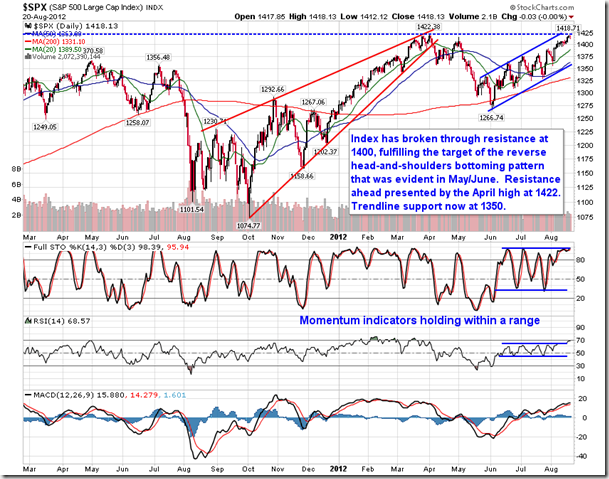
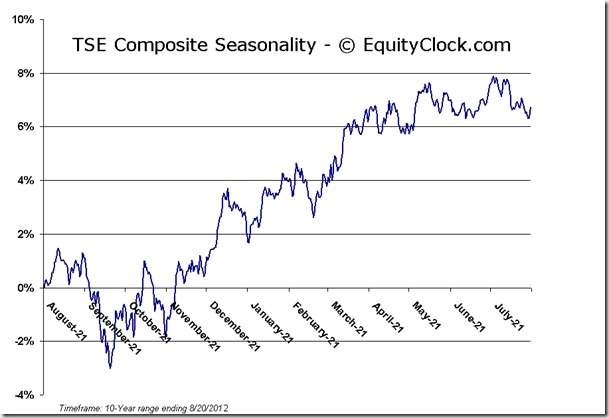
Chart Courtesy of StockCharts.com
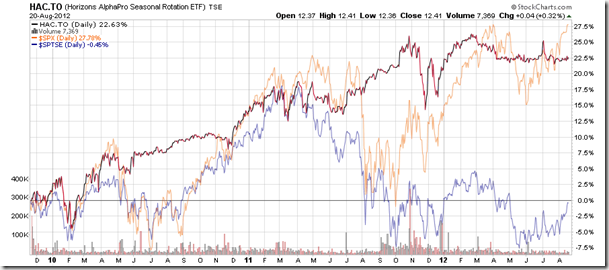
Horizons Seasonal Rotation ETF (TSX:HAC)
- Closing Market Value: $12.41 (up 0.32%)
- Closing NAV/Unit: $12.39 (down 0.03%)
Performance*
| 2012 Year-to-Date | Since Inception (Nov 19, 2009) | |
| HAC.TO | 1.72% | 23.9% |
* performance calculated on Closing NAV/Unit as provided by custodian
Click Here to learn more about the proprietary, seasonal rotation investment strategy developed by research analysts Don Vialoux, Brooke Thackray, and Jon Vialoux.


