by Don Vialoux, TechTalk
Economic News This Week
FOMC minutes for the July 31st /August 1st meeting are released at 2:00 PM EDT on Tuesday.
June Canadian Retail Sales to be released at 8:30 AM EDT on Wednesday are expected to increase 0.1% versus a gain of 0.3% in June.
July Existing Home Sales to be released at 10:00 AM EDT on Wednesday are expected to increase to 4.55 million units from 4.37 million units in June.
Weekly Initial Jobless Claims to be released at 8:30 AM EDT on Thursday are expected slip to 365,000 from 366,000 last week.
July New Home Sales to be released at 10:00 AM EDT on Thursday are expected to increase to 368,000 from 350,000 in June.
July Durable Goods Orders to be released at 8:30 AM EDT on Friday are expected to increase 2.5% versus a gain of 1.3% in June. Excluding transportation, Goods are expected to increase 0.5% versus a decline of 1.4% in June.
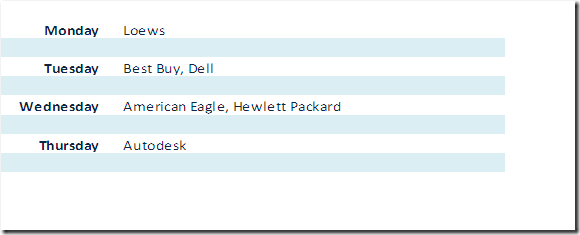
Earnings Reports This Week
Equity Trends
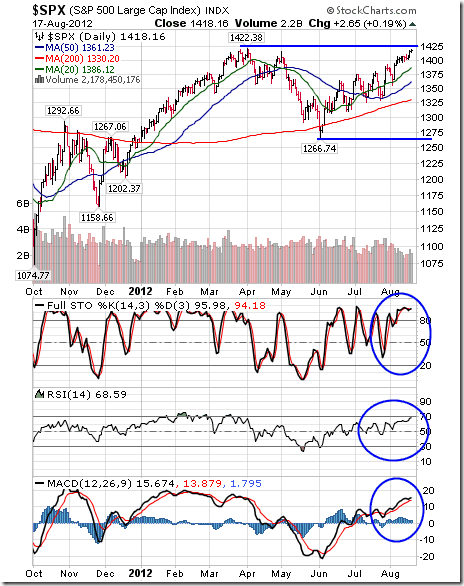
The S&P 500 Index added 12.29 points (0.87%) last week. Intermediate trend changed from down to neutral on a break above resistance at 1,415.23. Next resistance is at 1,422.38. The Index remains above its 20, 50 and 200 day moving averages. Short term momentum indicators are overbought, but have yet to show signs of peaking.
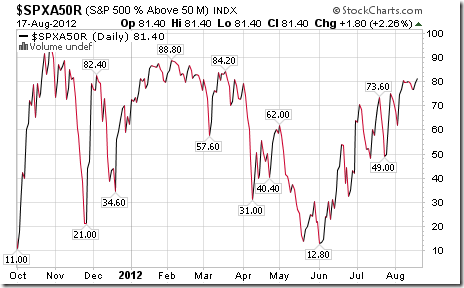
Percent of S&P 500 stocks trading above their 50 day moving average increased last week to 81.40% from 80.20%. Percent is intermediate overbought, but has yet to show signs of peaking. Percent has reached a level where an intermediate peak above the 80% level normally leads to at least a short term correction.
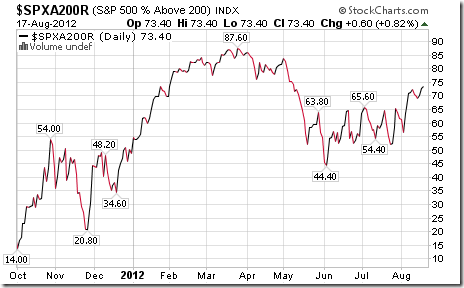
Percent of S&P 500 stocks trading above their 200 day moving average increased last week to 73.40% from 70.60%. Percent remains intermediate overbought, but has yet to show signs of peaking
The ratio of S&P 500 stocks in an uptrend to a downtrend (i.e. the Up/Down ratio) increased last week to (289/128=) 2.26 from 1.92. The ratio is intermediate overbought, but has yet to show signs of peaking.
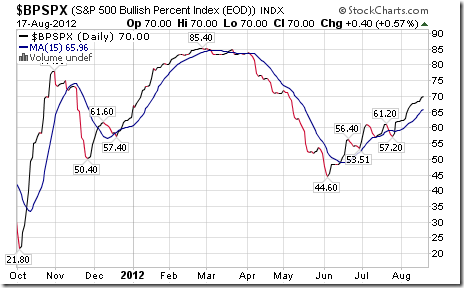
Bullish Percent Index for S&P 500 stocks increased last week to 70.00% from 67.80% and remained above its 15 day moving average. The Index remains intermediate overbought, but has yet to show signs of peaking.
The Up/Down ratio for TSX Composite stocks increased last week to (139/81=) 1.72 from 1.46. The ratio is intermediate overbought, but has yet to show signs of peaking.
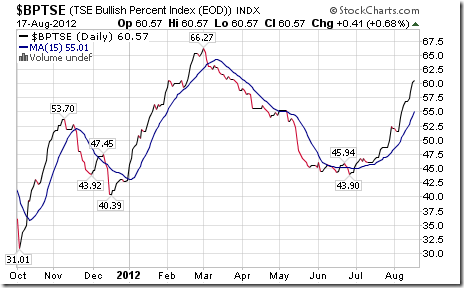
Bullish Percent Index for TSX Composite stocks increased last week to 60.57% from 56.91% and remained above its 15 day moving average. The Index remains intermediate overbought, but has yet to show signs of peaking.
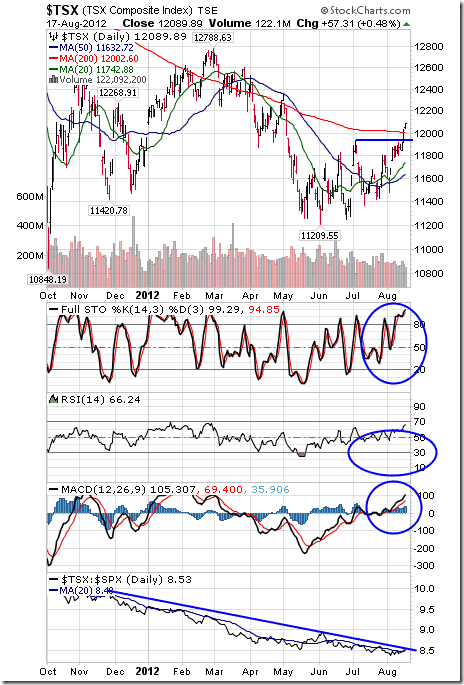
The TSX Composite Index gained another 199.00 points (1.67%) last week. Intermediate trend changed from down to up on a break above resistance at 11,936.16. The Index remains above its 20, 50 and 200 day moving averages. Short term momentum indicators are overbought, but have yet to show signs of peaking. Strength relative to the S&P 500 Index remains negative.
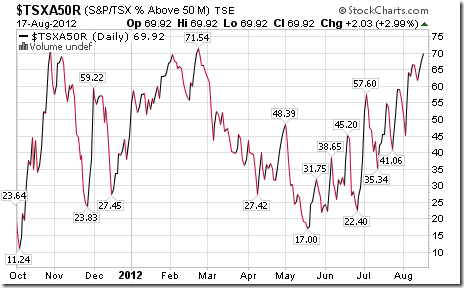
Percent of TSX stocks trading above their 50 day moving average increased last week to 69.92% from 66.26%. Percent is intermediate overbought, but has yet to show signs of peaking. Peaks near the 70% level normally lead to at least a short term correction by the Index.
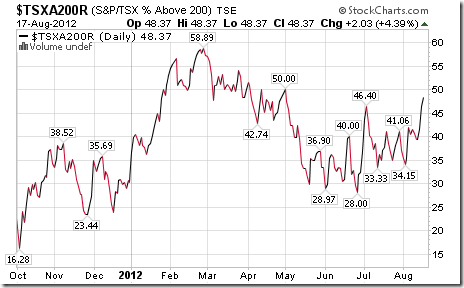
Percent of TSX stocks trading above their 200 day moving average increased last week to 48.37% from 40.65%. Percent continues to trend higher.
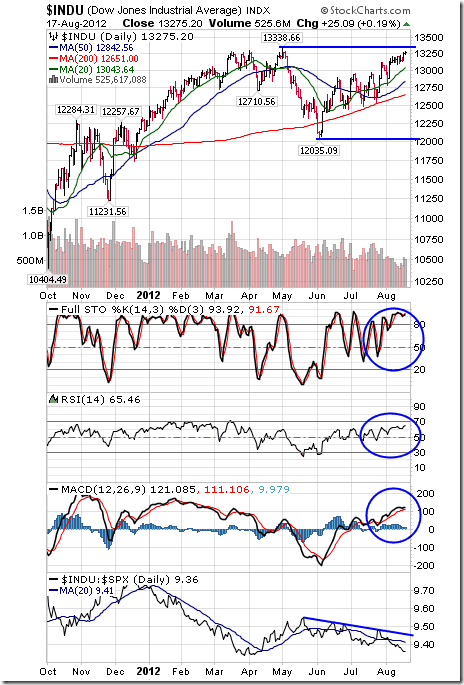
The Dow Jones Industrial Average gained another 67.25 points (0.51%) last week. Intermediate trend is up. Next resistance is at 13,338.66. The Average remains above its 20, 50 and 200 day moving averages. Short term momentum indicators are overbought, but have yet to show signs of peaking. Strength relative to the S&P 500 Index remains negative.
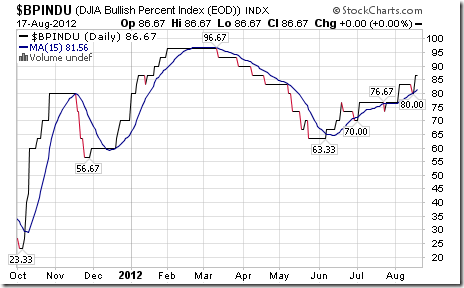
Bullish Percent Index for Dow Jones Industrial Average stocks increased last week to 86.67% from 83.33% and remained above its 15 day moving average. The Index remains intermediate overbought, but has yet to show signs of peaking.
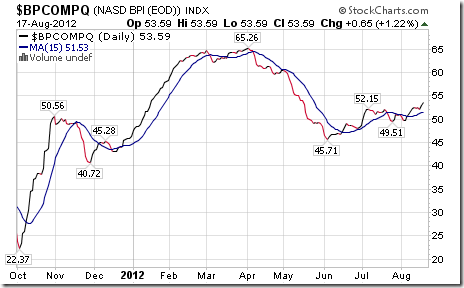
Bullish Percent Index for NASDAQ Composite stocks increased last week to 53.69% from 52.42% and remained above its 15 day moving average. The Index continues to trend higher.
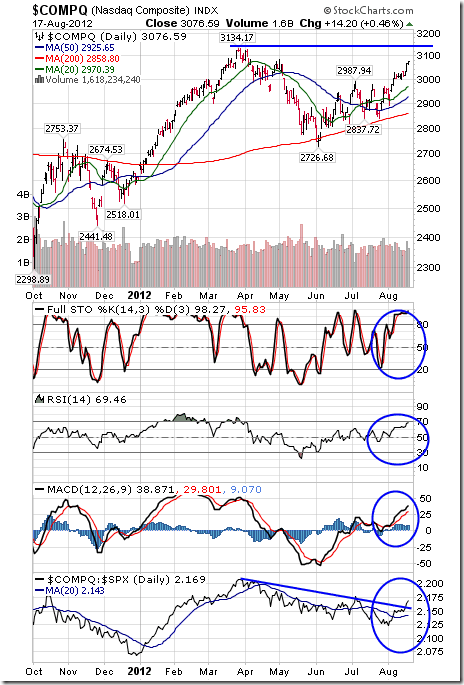
The NASDAQ Composite Index gained another 57.74 points (1.81%) last week. Intermediate trend is up. Next resistance is at 3,134.17. The Index remains above its 20, 50 and 200 day moving averages. Short term momentum indicators are overbought, but have yet to show signs of peaking. Strength relative to the S&P 500 Index has changed from negative to at least neutral.
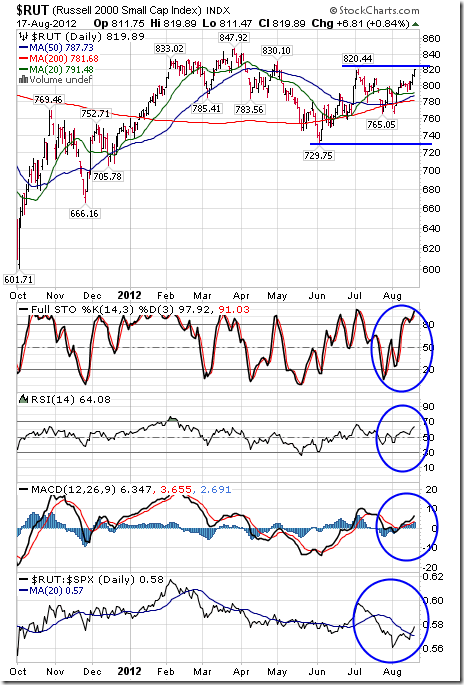
The Russell 2000 Index added 18.34 points (2.29%) last week. Intermediate trend is down, but turns positive on a break above resistance at 820.44. The Index remains above its 20, 50 and 200 day moving averages. Short term momentum indicators are overbought, but have yet to show signs of peaking. Strength relative to the S&P 500 Index has changed from negative to at least neutral.
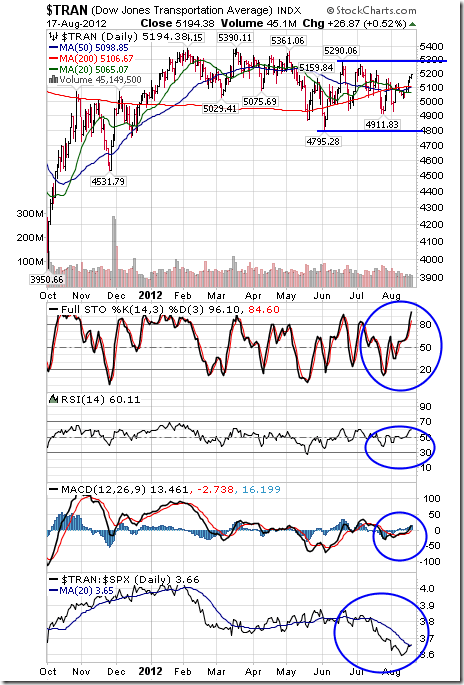
The Dow Jones Transportation Average gained 130.83 points (2.58%) last week. Intermediate trend is down. Resistance is at 5,290.06. The Average moved back above its 20, 50 and 200 day moving averages. Short term momentum indicators are overbought, but have yet to show signs of peaking. Strength relative to the S&P 500 Index remains negative.
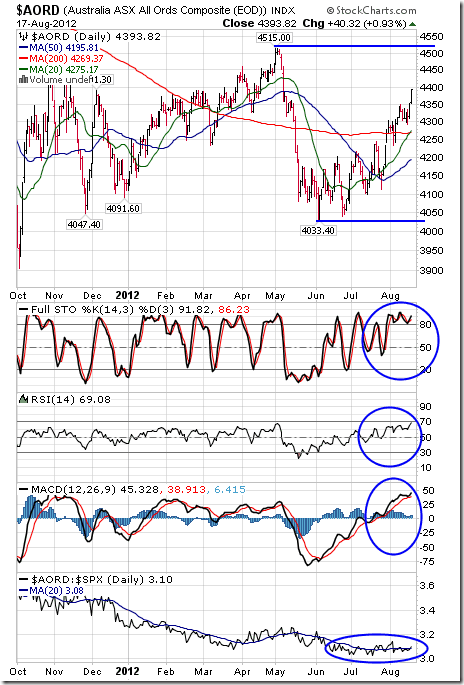
The Australia All Ordinaries Composite Index added 91.02 points (2.12%) last week. Intermediate trend is down. Support is at 4,033.40 and resistance is at 4,515.00. The Index remains above its 20, 50 and 200 day moving averages. Short term momentum indicators are overbought, but have yet to show signs of peaking. Strength relative to the S&P 500 Index remains neutral.
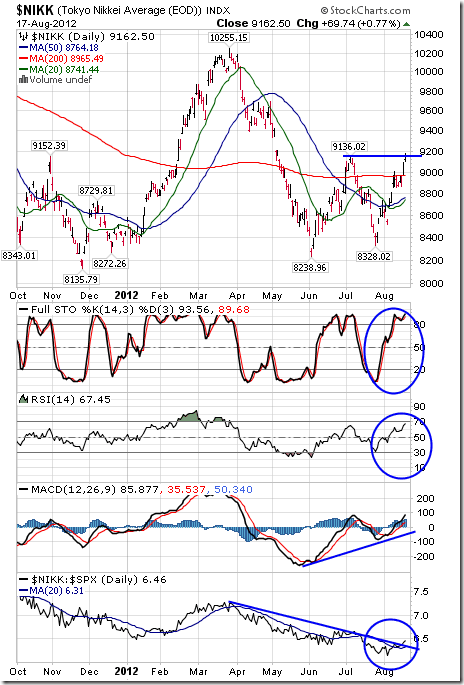
The Nikkei Average gained another 271.06 points (3.05%) last week. Intermediate trend changed from down to up on a break above resistance at 9,136.02 on Friday. The Average remains above its 20 and 50 day moving averages and moved above its 200 day moving average last week. Short term momentum indicators are overbought, but have yet to show signs of peaking. Strength relative to the S&P 500 Index has changed from negative to at least neutral.
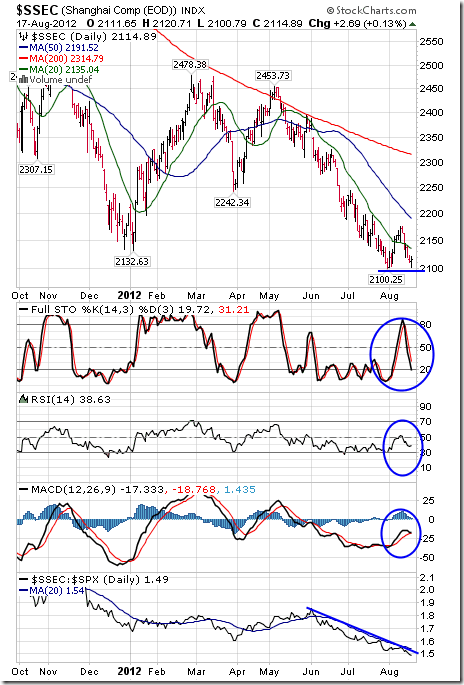
The Shanghai Composite Index slipped another 53.92 points (2.49%) last week. Intermediate trend is down. The Index remains below its 50 and 200 day moving averages and fell below its 20 day moving averages last week. Short term momentum indicators are trending down. Strength relative to the S&P 500 Index remains negative.
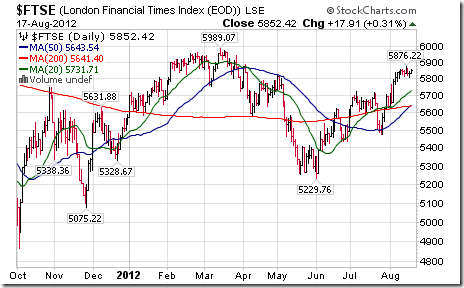
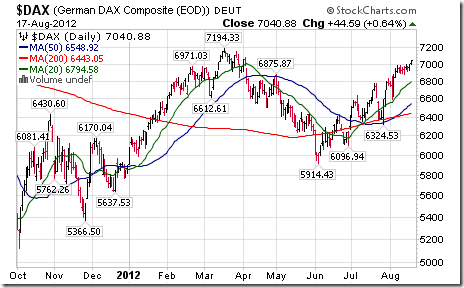
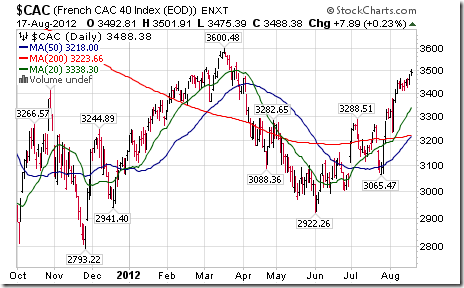
The London FT Index added 0.91 (0.02%), the Frankfurt DAX Index improved 75.89 points (1.09%) and the Paris CAC Index gained 31.67 points (0.92%) last week.
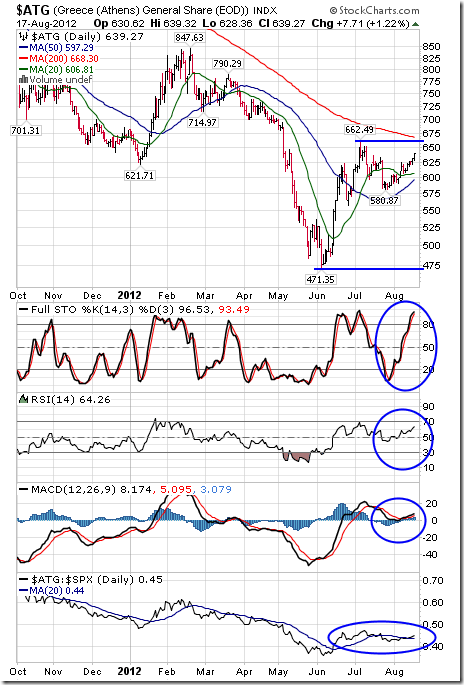
The Athens Index added 21.04 points (3.40%) last week. The Index remained above its 20 and 50 day moving averages. Short term momentum indicators are overbought, but have yet to show signs of peaking. Strength relative to the S&P 500 Index remains slightly negative.
Currencies
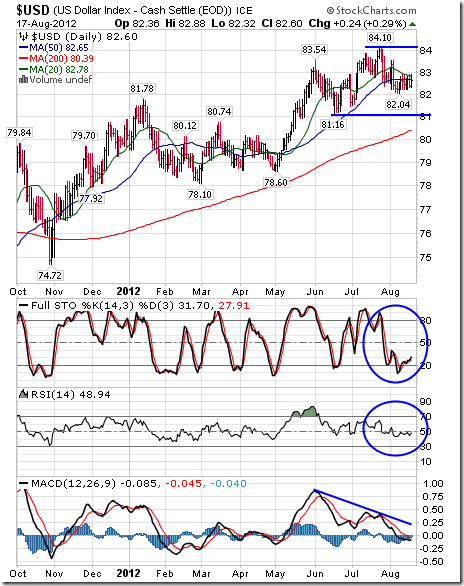
The U.S. Dollar Index added 0.05 (0.06%) last week. Intermediate trend is up. Support is at 81.16 and resistance is at 84.10. The Index remains just below its 20 and 50 day moving averages. Short term momentum indicators are trending down. Stochastics already are oversold.
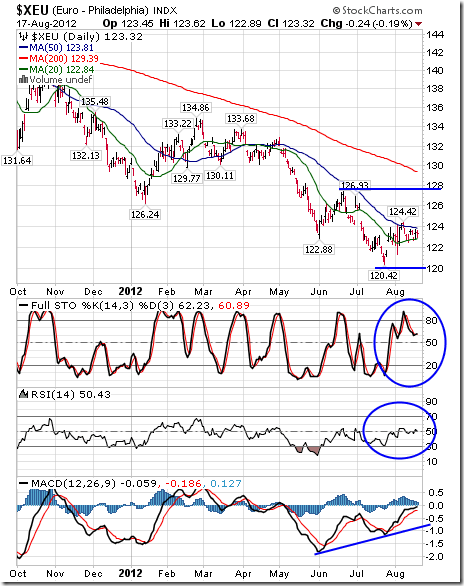
The Euro added 0.42 (0.34%) last week. Intermediate trend is down. Support is at 120.42 and resistance is at 126.93. The Euro remains below its 50 and 200 averages, but remains above its 20 day moving average. Short term momentum indicators are trending higher. Stochastics already are overbought.
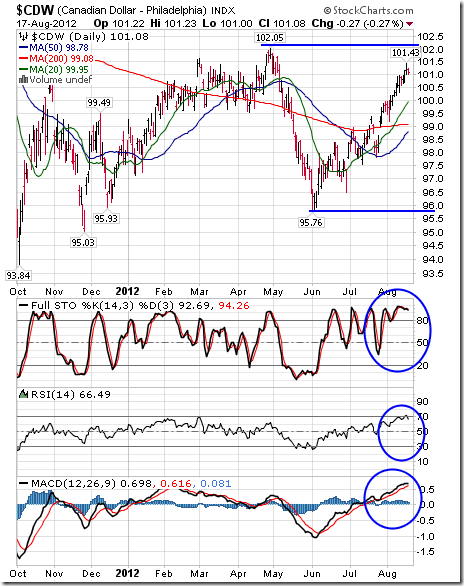
The Canadian Dollar added 0.18 U.S. cents (0.17%) last week. Intermediate trend is neutral. Support is at 95.76 and resistance is at 102.05. The Dollar remains above its 20, 50 and 200 day moving averages. Short term momentum indicators are overbought, but have yet to show signs of peaking.
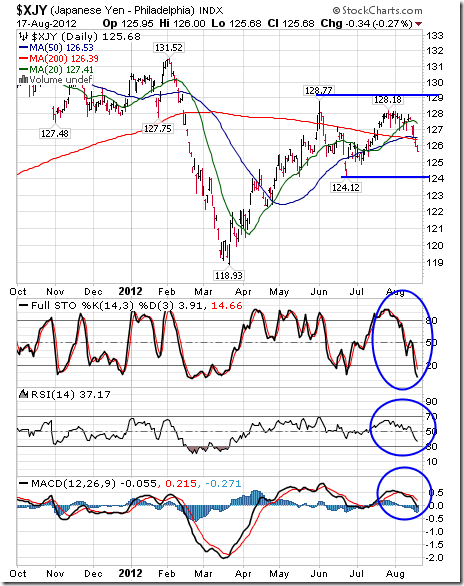
The Japanese Yen fell 2.07 (1.62%) last week. Intermediate trend is down. Support is at 124.12 and resistance is at 128.77. The Yen fell below its 20, 50 and 200 day moving averages. Short term momentum indicators are trending down. Stochastics already are oversold.
Commodities
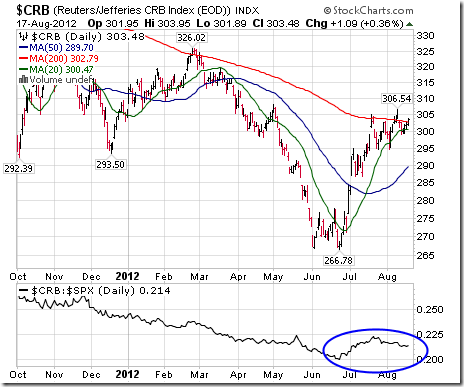
The CRB Index added 1.67 points (0.55%) last week. Intermediate trend is up. The Index remains above its 20, 50 and 200 day moving averages. Strength relative to the S&P 500 Index has turned neutral.
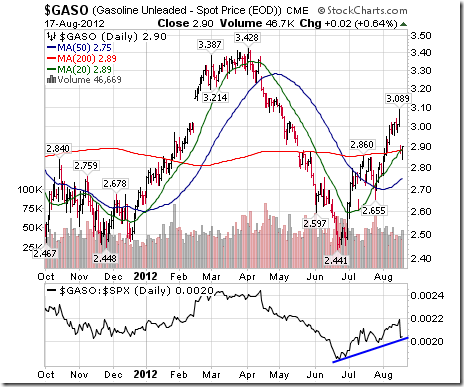
Gasoline dropped $0.11 (3.65%) when the futures contract rolled over. Gasoline remains above its 20, 50 and 200 day moving averages. Strength relative to the S&P 500 Index remains positive.
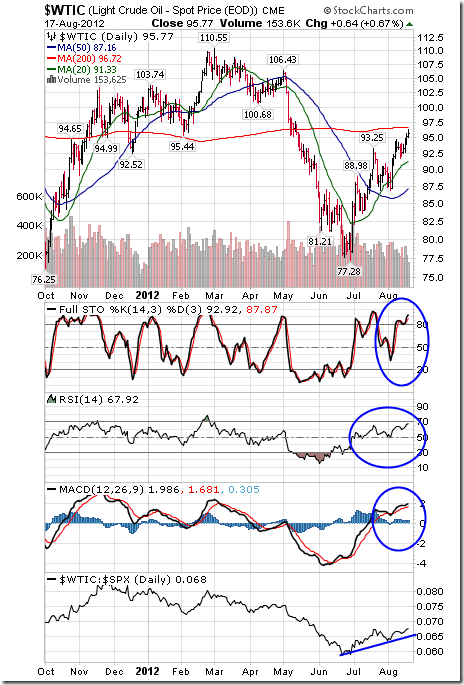
Crude oil gained another $2.39 per barrel (2.56%) last week. Intermediate trend is up. Crude remains above its 20 and 50 day moving averages and just below its 200 day moving average. Short term momentum indicators are overbought, but have yet to show signs of peaking. Strength relative to the S&P 500 Index remains positive.
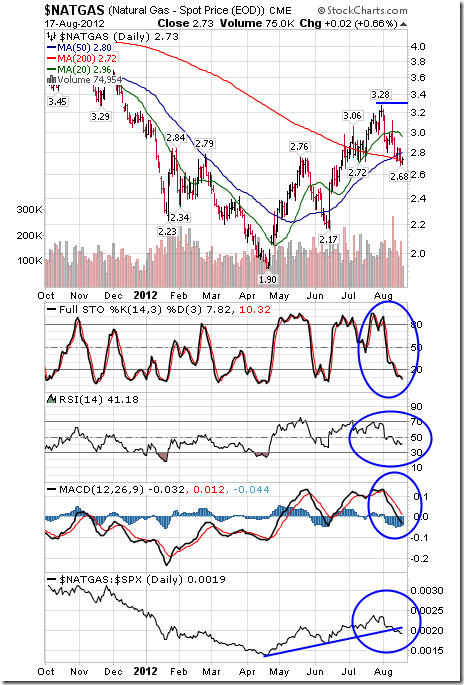
Natural Gas fell another $0.06 per MBtu (2.15%) last week. Intermediate trend is up. Resistance has formed at $3.28. Gas remains below its 50 day moving average and fell below its 20 day moving average last week. Short term momentum indicators are trending down. Strength relative to the S&P 500 Index has changed from up to at least neutral.
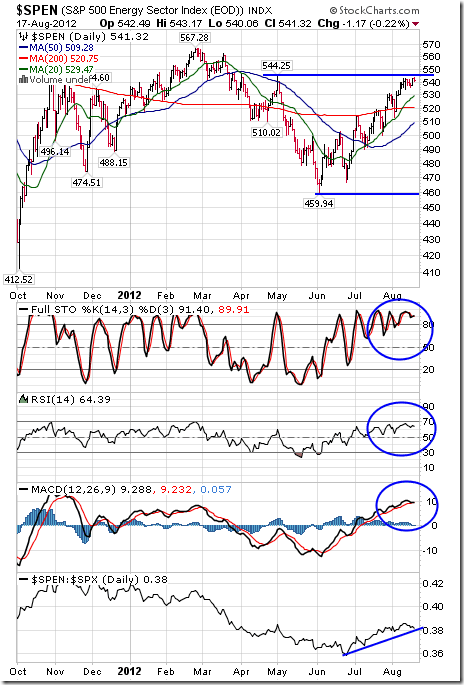
The S&P Energy Index slipped 0.78 points (0.14%) last week. The Index is testing resistance at 544.25. The Index remains above its 20, 50 and 200 day moving averages. Short term momentum indicators are overbought, but have yet to show signs of peaking. Strength relative to the S&P 500 Index remains positive.
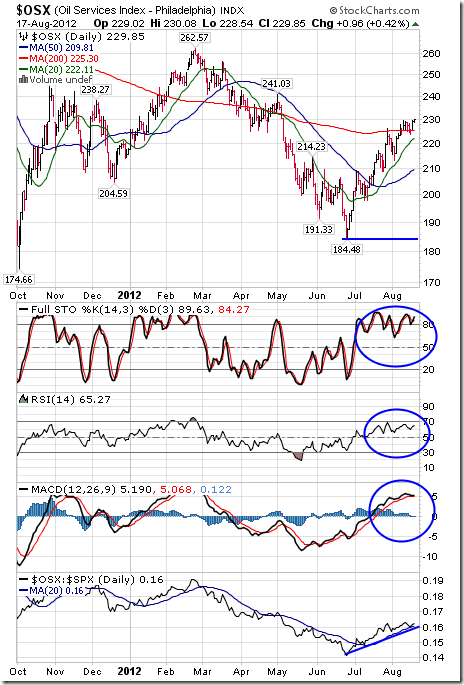
The Philadelphia Oil Services Index gained 0.97 (0.42%) last week. The move above a reverse head and shoulder pattern continues. The Index remains above its 20, 50 and 200 day moving averages. Strength relative to the S&P 500 Index remains positive.
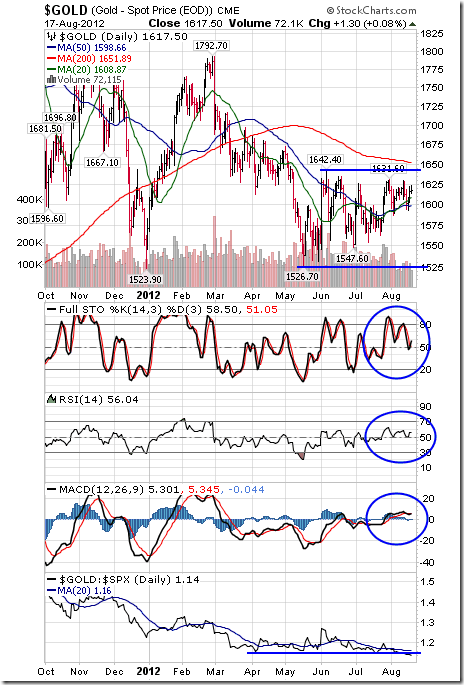
Gold slipped $4.00 per ounce (0.25%) last week. Intermediate trend is down. Support is at $1,526.70 and resistance is at $1,642.40. Gold remains above its 20 and 50 day moving averages and below its 200 day moving averages. Short term momentum indicators are neutral. Strength relative to the S&P 500 Index remains neutral.
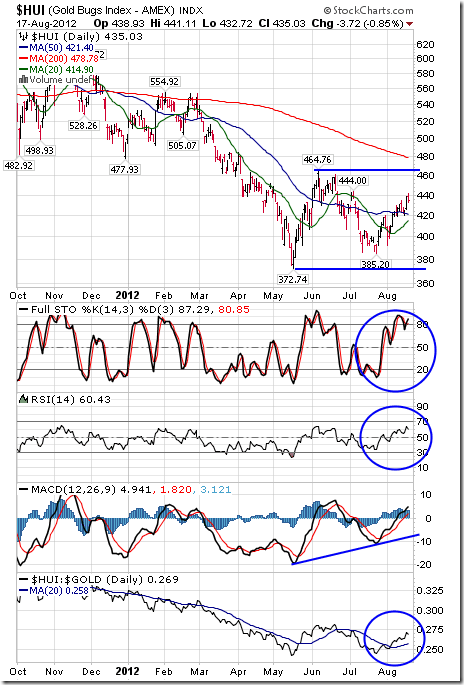
The AMEX Gold Bug Index added 4.88 points (1.13%) last week. Intermediate trend is down. Support is at 372.74 and resistance is at 464.76. The Index remains above its 20 and 50 day moving averages. Short term momentum indicators are trending higher. Strength relative to gold remains positive.
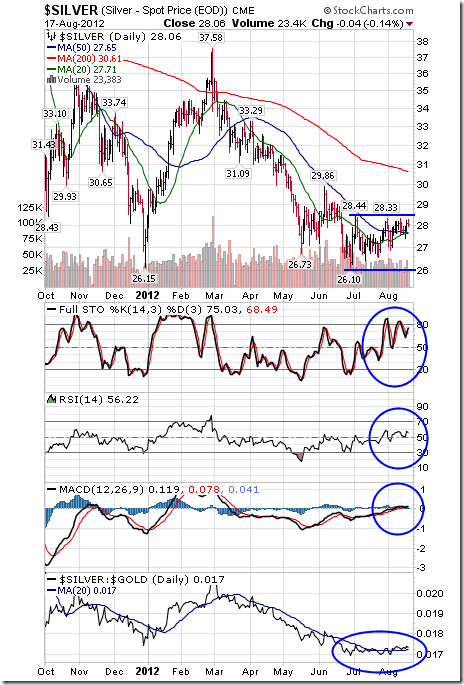
Silver added $0.01 per ounce (0.04%) last week. Intermediate trend is down. Support is at $26.10 and resistance is at $28.44. Silver remains below its 200 day moving average and above its 20 and 50 day moving averages. Short term momentum indicators are trending higher. Strength relative to gold remains neutral.
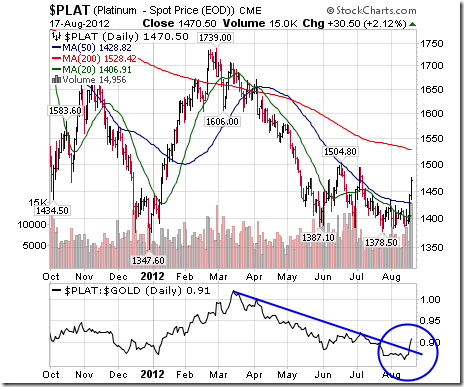
Platinum jumped $68.90 per ounce (4.92%) last week following labor strife at Lonvin, the world’s third largest platinum mine. Strength relative to gold turned from negative to positive. Platinum moved above its 20 and 50 day moving average.
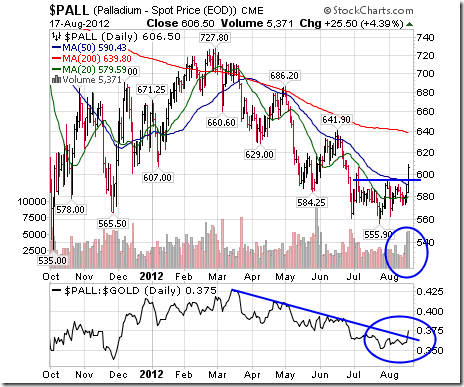
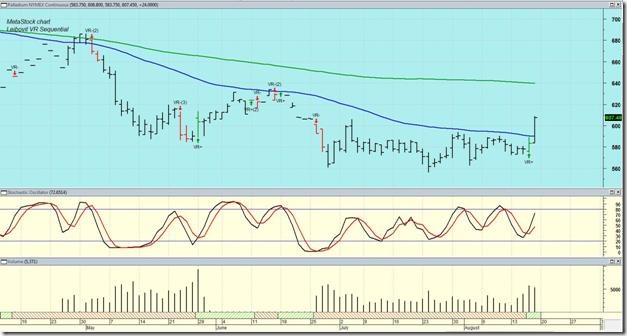
Palladium jumped $23.75 (4.00%) last week. Nice breakout on Friday on a Leibovit Volume Reversal! Strength relative to the S&P 500 Index had turned from negative to positive.
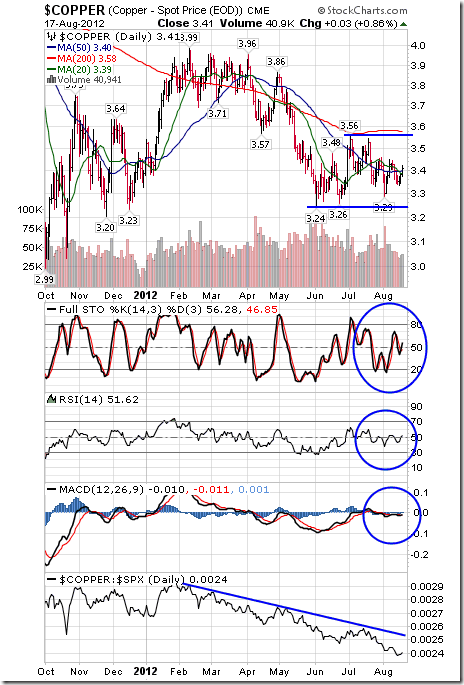
Copper was unchanged last week. Intermediate trend is down. Support is at $3.24 and resistance is at $3.56. Copper moved back above its 20 and 50 day moving averages on Friday. Short term momentum indicators are neutral. Strength relative to the S&P 500 Index remains negative.
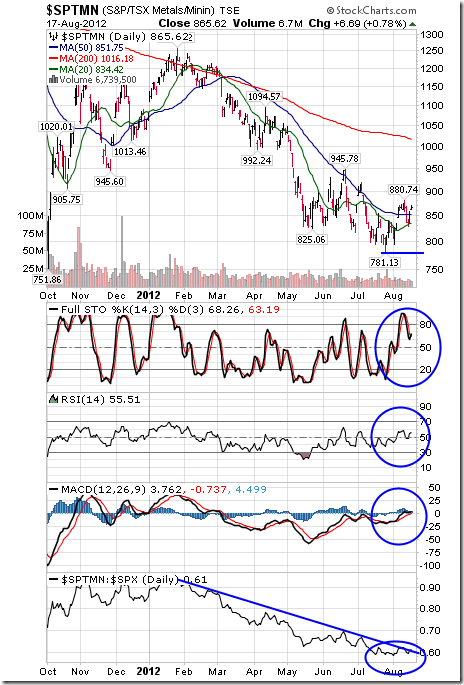
The TSX Global Metals and Mining Index eased 8.48 points (0.97%) last week. Intermediate trend is down. Support is at 781.13. The Index remains above its 20 and 50 day moving averages. Short term momentum indicators are trending higher. Stochastics already are overbought. Strength relative to the S&P 500 Index has been negative and showing early signs of change.
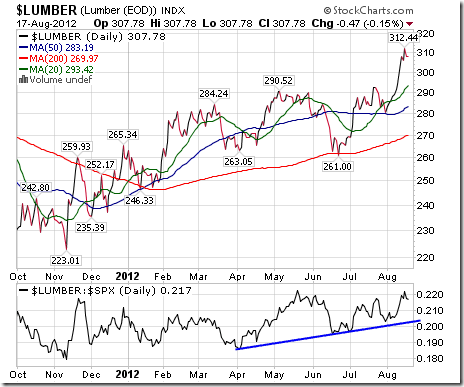
Lumber gained another 6.89 points (2.29%) last week. Lumber remains above its 20, 50 and 200 day moving averages. Strength relative to the S&P 500 Index remains positive.
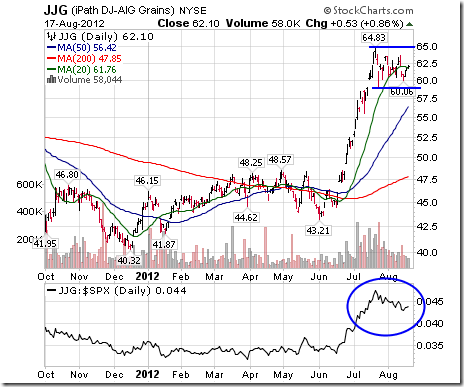
The Grain ETN slipped $0.22 (0.35%) last week. Units remain above their 20, 50 and 200 day moving averages. Strength relative to the S&P 500 Index has turned negative.
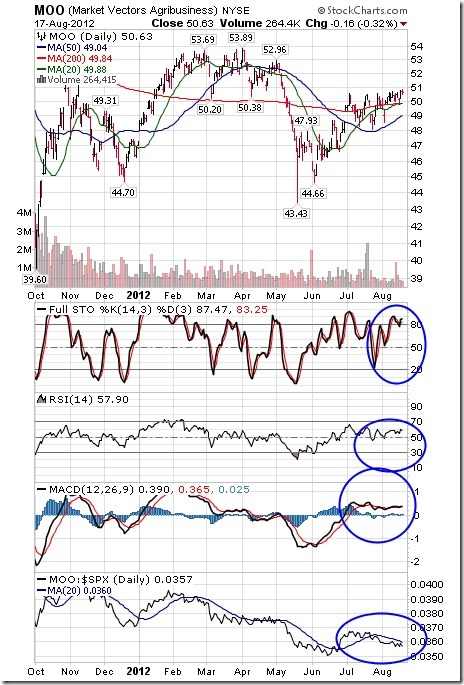
The Agriculture ETF added $0.23 (0.46%) last week. Intermediate trend is up. Units remain above their 20, 50 and 200 day moving averages. Short term momentum indicators are overbought and showing early signs of peaking. Strength relative to the S&P 500 Index remains negative.
Interest Rates
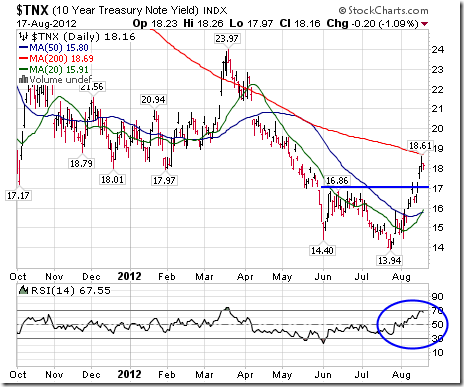
The yield on 10 year Treasuries increase 16.7 basis points (1.01%) last week. Short term momentum indicators are overbought, but have yet to show signs of peaking.
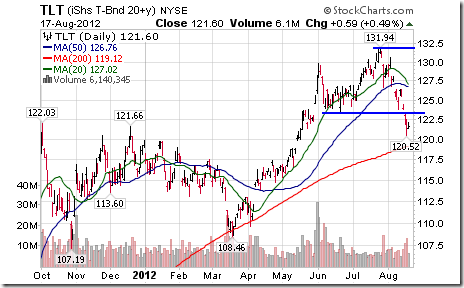
Conversely, price of the long term Treasury ETF fell another $4.10 (3.26%) last week.
Other Issues
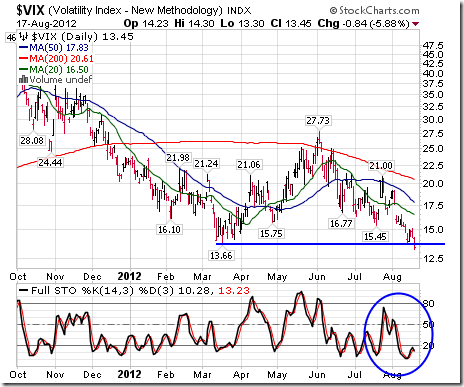
The VIX Index fell another 1.29 (8.75%) last week. It broke support at 13.66 to reach a five year low. Short term momentum indicators are oversold, but have yet to show signs of bottoming.
Earnings reports to be released this week are unlikely to have a significant impact on equity markets.
Economic reports this week are expected to be neutral/positive this week. Next major event is the Jackson Hole Economic conference where Benanke and Draghi are scheduled to speak.
Macro news heats up this week. China and the Eurozone release their PMI reports on Thursday. Mid-east tensions continue to ramp up.
Short and intermediate technical indicators for most equity markets and sectors are overbought, but have yet to show signs of peaking.
North American equity markets have a history of moving flat to lower in mid-August. September historically is the weakest month of the year. Seasonality turns positive after mid-October.
Cash on the sidelines on both sides of the border is substantial and growing. However, political uncertainties (including the Fiscal Cliff) preclude major commitments by investors and corporation. The selection of Paul Ryan as the Republican Vice President candidate has boosted Romney’s ratings on the polls, but the polls continue to show a tight race.
The Bottom Line
Equity markets on both sides of the border have had a good ride since their lows set on June 4th. The Dow Jones Industrial Average is up 10.3%, the S&P 500 Index has gained 12.0% and the TSX Composite has increased 7.9%. Investing in equity markets has become less attractive. Accumulation of seasonal trades on weakness continues to make sense as long as the seasonal trades are outperforming the market. Sectors in this category include agriculture, energy, leisure & entertainment, software and gold. A cautious bullish stance appears appropriate.
Tom Rogers’ Weekly Elliott Wave Blog
Following is a link:
http://www.tomrogers.net/signpost.htm
Special Free Services available through www.equityclock.com
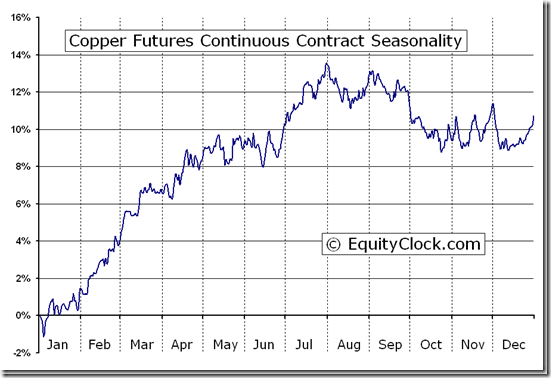
Equityclock.com is offering free access to a data base showing seasonal studies on individual stocks and sectors. The data base holds seasonality studies on over 1000 big and moderate cap securities and indices.
To login, simply go to http://www.equityclock.com/charts/
Following is an example:
ETF News
The latest weekly update on ETFs in Canada to August 17th is available at
Leibovit Volume Reversal Signal on Palladium
More information on Mark’s services is available at http://www.vrtrader.com/login/index.asp
Disclaimer: Comments and opinions offered in this report at www.timingthemarket.ca are for information only. They should not be considered as advice to purchase or to sell mentioned securities. Data offered in this report is believed to be accurate, but is not guaranteed.
Don and Jon Vialoux are research analysts for Horizons Investment Management Inc. All of the views expressed herein are the personal views of the authors and are not necessarily the views of Horizons Investment Management Inc., although any of the recommendations found herein may be reflected in positions or transactions in the various client portfolios managed by Horizons Investment Management Inc
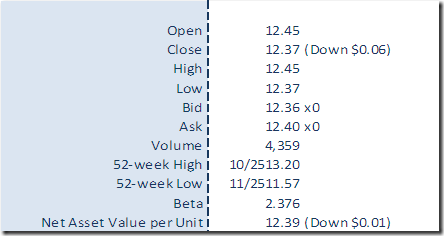
Horizons Seasonal Rotation ETF HAC August 17th 2012
Copyright © TechTalk


