Interesting Charts
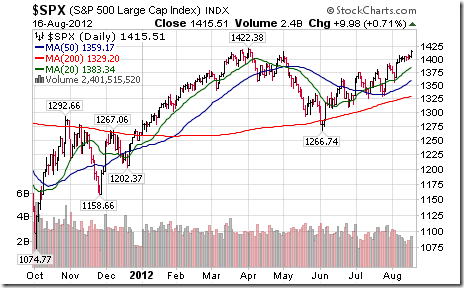
U.S. equity markets moved higher yesterday following comments by China’s premier implying an imminent monetary stimulus program to reflate the Chinese economy. The S&P 500 is testing its April high at 1,422.38.
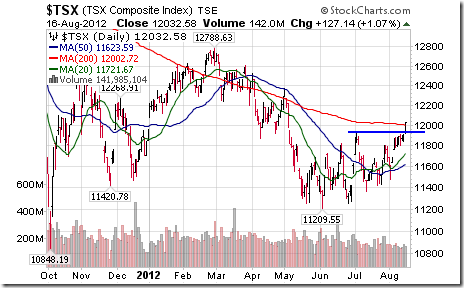
The TSX Composite responded to strength in U.S. equity markets and commodity prices (notably gold, silver, platinum and crude oil) by breaking above resistance at 11,936.16. Intermediate trend changed from down to up. The Index also closed above its 200 day moving average.
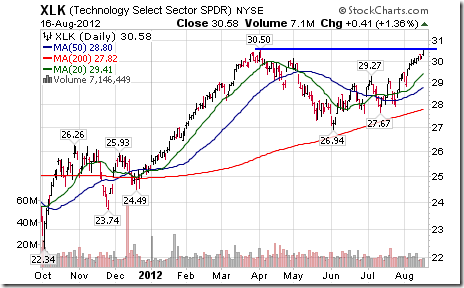
Technology led the advance in U.S. equity markets. Technology SPDRs broke above its April high to reach an 11 year high.
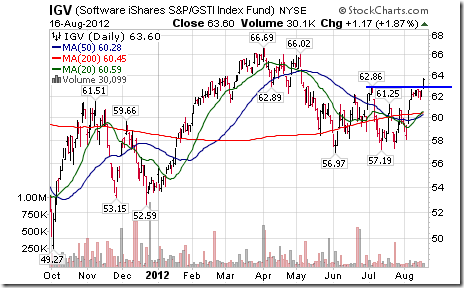
Notably stronger within the technology sector was software. ‘Tis the season!
S&P North American Technology-Software Index
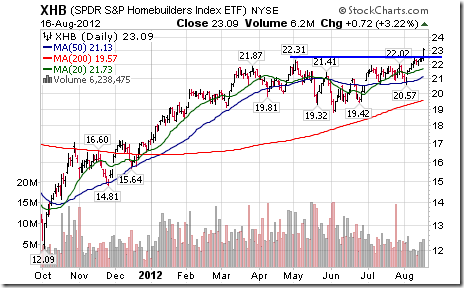
U.S. Homebuilder stocks and related ETFs have gained momentum during the past three weeks. Yesterday, the Homebuilder ETF broke above resistance to reach a four year high.
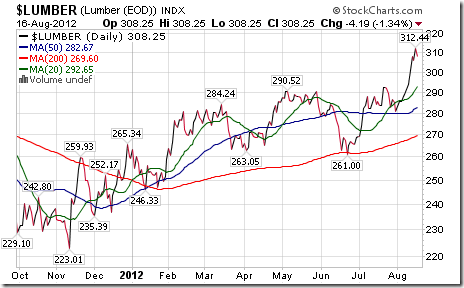
Lumber prices have responded to rising interest in the U.S. Homebuilder sector.
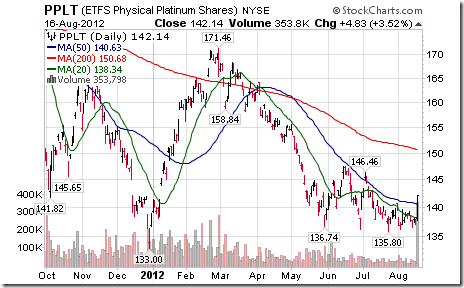
Precious metal prices and related equities and ETFs were notably stronger yesterday. Platinum finally started to play catch up with gold and silver partially because one of the world’s largest platinum mines closed down due to an accident that killed four miners.
Eric Wheatley’s Column
Preamble: For those of you who may only occasionally check the comments section here (I am one of them. I happened to look at the comments at the right time), tragic events happened to Tony the TAPBAF this week. Without going into further details, I’m offering my condolences to Tony and to his family in this difficult time.
*****************
Hello all,
We’re continuing with our options basics lessons which started a few weeks ago.
After covering why purchasing options isn’t as dumb as some may make it out to be, and is indeed a smart thing for traders who hold onto their positions for more than a week or two, it is time to go over how to sell options and why it is a very important thing for long-term investors.
I work for a guy who has been managing people’s money for quite some time. When I first met him in 2001, I was surprised that a retail portfolio manager would use options so coherently. In my experience, most brokers avoided options like the plague because: a) they don’t bring in much in commissions; b) they require extra regulatory supervision, which is viewed as a headache by most bank-owned brokerage houses and c) most brokerages nowadays only sell prefabricated portfolios. If you don’t own individual stocks, you certainly won’t be using options.
Mr. Hood offered me a job because of my experience in the markets and, especially, my practical, anti-theoretical knowledge of options; something few people really have. The reason options are so fundamental to our investment philosophy is that we are conservative people who seek good, stable, tax-efficient returns.
In the first commentary of this series, we presented the Ballad of George and Bob I recommend you go read it if you haven’t or don’t remember it because it will be the backbone to what follows). George sold a napkin to Bob. Bob, it is intuitively understood, is a speculator who thinks that XYZ will be going up and the napkin gives him a low-cost exposure to the stock. George, on the other hand, is an investor who wants good, stable returns.
George got $2.50 for a three-month call option. In selling the option, he promised Bob that he would sell his 100 shares to Bob for $50 per share if the stock’s price were to rise. Of course, the first knee-jerk reaction to this is that putting a ceiling on one’s potential gains for a measly $2.50 is stupid; particularly if you are holding the shares, so if their price drops through the floor, you’re on the hook. (Put another way, the MOST George could gain is $2.50, yet he could lose his shirt if XYZ were to drop to zero. This concept is hard to defend if your interlocutor has little understanding of finance and just wants to get rich in the stock market).
Let’s look at this differently. Firstly, the $2.50 George gets from Bob is pocketed – it is his, no matter what happens. This $2.50, on a stock that was purchased at $50, represents a 5% immediate gain. Given that this $2.50 is on a three-month option, the 5% is equivalent to an immediate 20% annualised return. The $2.50 is to compensate George for transferring his XYZ’s upside to Bob. In other words, Bob, thinking that XYZ will be going up fast, paid George in advance for its potential gains over the coming three months.
Now, how does this apply to you? If you are an experienced investor, you’ve no doubt noticed that even the best stock pickers rarely get too far above 50/50 over the short term in terms of outperforming the market (if the market is rising and the stock pickers’ picks rose, you still have to compare how their picks did against other, similar shares before you canonise them and worship their brilliance). Given that we principally use index ETFs, holding the broad market and certain specific sectors we like, we minimise trading costs and realised taxable events. Covering these positions with calls allows us to smooth out the returns and lessen the impact of sudden drops. Why? Well, in George’s case, if XYZ were to drop to $45, George only loses $2.50 ($5 minus the $2.50 he took in). If he hadn’t covered his shares, he would have lost $5.00. Over the short term, the money taken in from selling calls has a dampening effect on one’s losses.
For those who are wondering “what if XYZ were a really risky stock?!!”: in such a case, George wouldn’t have sold his napkin for $2.50. He would have required Bob to pay much more for the napkin in order for the money taken in to compensate him for the added downside risk. As always, greater risk means greater returns.
The list of arguments in favour of covered calls is extensive and we’ve previously gone into a lot of them, which you can find on Fridays in the archives. The main idea is that we like to pick a solid portfolio of holdings which won’t completely melt down a portfolio’s value in the darkest timeline. We then cover these holdings every few months and take in money which provides a buffer against adverse moves. We may underperform if the market takes off suddenly, but the probability of such an occurrence has to be weighed against the returns we’re taking in and the different options which are available to us. All in all, we’re reducing the risk of our portfolios and getting solid returns, which is the main argument in favour of what we do.
In this week’s French-language blog: my loudmouthed neighbour is back and he’s bought himself a duplex.
Cheers!
Éric Wheatley, MBA, CIM
Associate Portfolio Manager, J.C. Hood Investment Counsel Inc.
eric@jchood.com
514.604.2829; 1.855.348.2829
Twitter: @jchood_eric
Blogue en français : gbsfinancier.blogspot.ca
*****************
Little known fact about John Charles Hood #39
John Charles Hood dislikes volatility in everything but his gunpowder.
Dave Skarica’s Comments on Precious Metals
I have enclosed a recent interview with my friend Mike Swanson where we talk about the great opportunities in precious metals stocks and in the coming years. PLEASE CLICK HERE to listen to this interview.
Sincerely,
David Skarica

Speaker Spotlight
Adam Sorab
IFTA President, CQS Management Limited – Head of Technical Research
Adam Sorab is Head of Technical Research at CQS, a $12 billion hedge fund management company. Prior to joining CQS in 2004, Adam was Director of Absolute Return Strategies at Deutsche Asset Management, responsible for Europe & Middle East. Adam joined DeAM from CSFB, where he was a founding member and a Director of the firm’s hedge fund operation, the Leveraged Funds Group.
Before this, he worked at Schroders in London as a currency and interest rates derivatives trader. Adam holds a BSc (Hons) in Economics from the London School of Economics (1984). He has been President of IFTA since 2010 and is a Fellow and former Chairman of the UK Society of Technical Analysts (STA). Adam is also a Member of the Investment Committee of the BUPA Pension Fund in the UK.
Pricing
CSTA/MTA/IFTA Members
$599.00
Non-Members
$699.00
Special Free Services available through www.equityclock.com
Equityclock.com is offering free access to a data base showing seasonal studies on individual stocks and sectors. The data base holds seasonality studies on over 1000 big and moderate cap securities and indices.
To login, simply go to http://www.equityclock.com/charts/
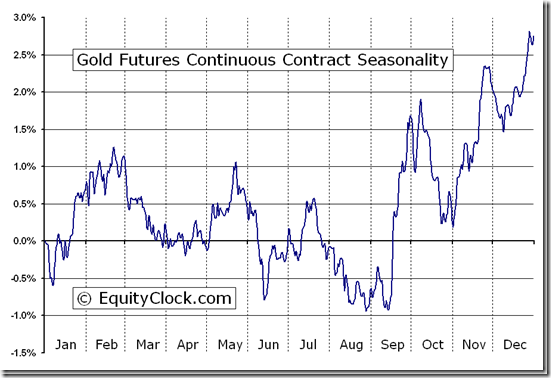
Following is an example:
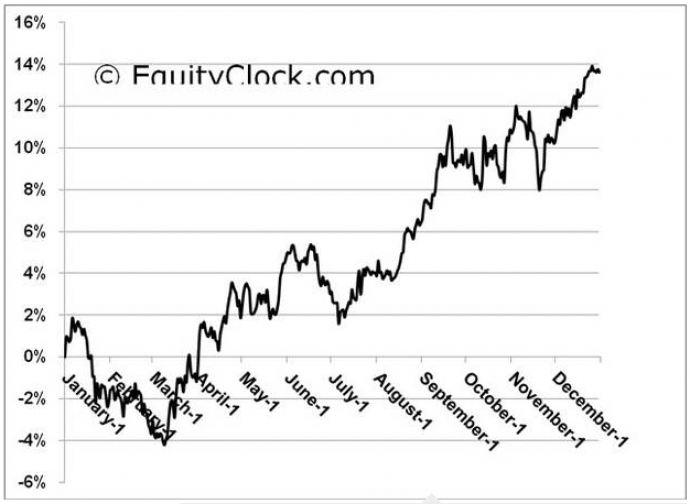
Gold Futures (GC) Seasonal Chart
FP Trading Desk Headline
FP Trading Desk headline reads, “Canadian bank earnings expected to increase”. Following is a link to the report.
http://business.financialpost.com/2012/08/16/canadian-bank-earnings-expected-to-increase-7/
Disclaimer: Comments and opinions offered in this report at www.timingthemarket.ca are for information only. They should not be considered as advice to purchase or to sell mentioned securities. Data offered in this report is believed to be accurate, but is not guaranteed.
Don and Jon Vialoux are research analysts for Horizons Investment Management Inc. All of the views expressed herein are the personal views of the authors and are not necessarily the views of Horizons Investment Management Inc., although any of the recommendations found herein may be reflected in positions or transactions in the various client portfolios managed by Horizons Investment Management Inc
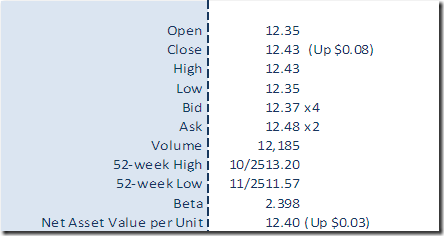
Horizons Seasonal Rotation ETF HAC August 16th 2012


