by Don Vialoux, EquityClock.com
Upcoming US Events for Today:
- Weekly Jobless Claims will be released at 8:30am. The market expects Initial Claims to show 368K versus 361K previous. Continuing Claims are expected to reveal 3300K versus 3332K previous.
- Housing Starts for July will be released at 8:30am. The market expects 763K versus 760K previous. Building Permits are expected to reveal 770K versus 755K previous.
- The Philadelphia Fed Survey for August will be released at 10:00am. The market expects –5.0 versus –12.9 previous.
Upcoming International Events for Today:
- Great Britain Retail Sales for July will be released at 4:30am EST. The market expects a year-over-year increase of 1.6% versus 1.4% previous.
- Euro-Zone Consumer Price Index for July will be released at 5:00am EST. The market expects a year-over-year increase of 2.4%, consistent with the previous report.
Recap of Yesterday’s Economic Events:
| Event | Actual | Forecast | Previous |
| GBP Claimant Count Rate | 4.90% | 4.90% | 4.90% |
| GBP Jobless Claims Change | -5.9K | 6.0K | 1.0K |
| USD MBA Mortgage Applications | -4.50% | -1.80% | |
| USD Consumer Price Index (MoM) | 0.00% | 0.20% | 0.00% |
| USD Consumer Price Index n.s.a. | 229.104 | 229.505 | 229.478 |
| USD Consumer Price Index Ex Food & Energy (MoM) | 0.10% | 0.20% | 0.20% |
| USD Consumer Price Index (YoY) | 1.40% | 1.60% | 1.70% |
| USD Consumer Price Index Ex Food & Energy (YoY) | 2.10% | 2.20% | 2.20% |
| USD Consumer Price Index Core Index s.a. | 230.124 | 229.916 | |
| USD Empire Manufacturing | -5.85 | 7 | 7.39 |
| USD Net Long-term TIC Flows | $9.3B | $40.0B | $55.9B |
| USD Total Net TIC Flows | $16.7B | $121.3B | |
| CAD Existing Home Sales (MoM) | 0.00% | -1.30% | |
| USD Capacity Utilization | 79.30% | 79.20% | 78.90% |
| USD Manufacturing (SIC) Production | 0.50% | 0.50% | 0.50% |
| USD Industrial Production | 0.60% | 0.50% | 0.10% |
| USD NAHB Housing Market Index | 37 | 35 | 35 |
| USD DOE Cushing OK Crude Inventory | 899K | -802K | |
| USD DOE U.S. Crude Oil Inventories | -3699K | -1500K | -3729K |
| USD DOE U.S. Distillate Inventory | 677K | -275K | -724K |
| USD DOE U.S. Gasoline Inventories | -2371K | -2000K | -1801K |
| NZD Business NZ Performance of Manufacturing Index | 49.4 | 50 |
The Markets
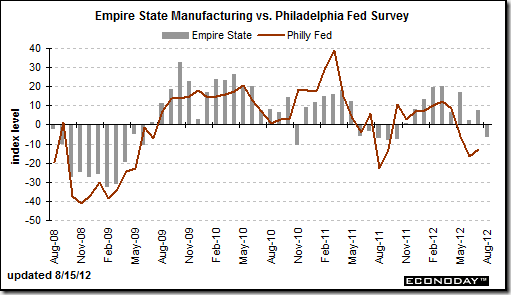
Equity markets finished little changed on Wednesday on extremely light volume as investors digested a mixed set of economic reports. Volume, yet again, was dismal with the S&P 500 ETF showing the lowest activity of the year. The NAHB Hosing Market Index was reported at the highest level since 2007, fueling confidence that a rebound in the housing market is upon us. However, at the other end of the “hope” spectrum, a report on manufacturing significantly missed estimates, reiterating that the economy is still struggling. The Empire Manufacturing Survey for August was reported at –5.85, below even the lowest analyst estimate at –2; the average analyst estimate was for a print of +7, essentially unchanged from the previous report. Manufacturing remains seasonally negative until October, suggesting further pain could be realized before a rebound takes hold. The Philly Fed Index, a key gauge of manufacturing activity, will be released on Thursday.
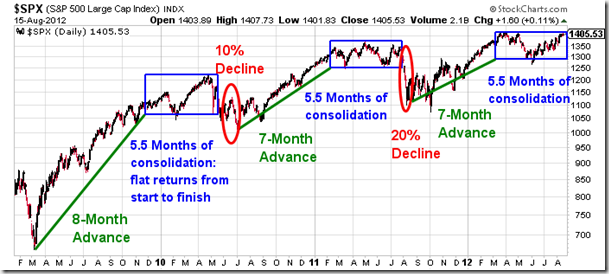
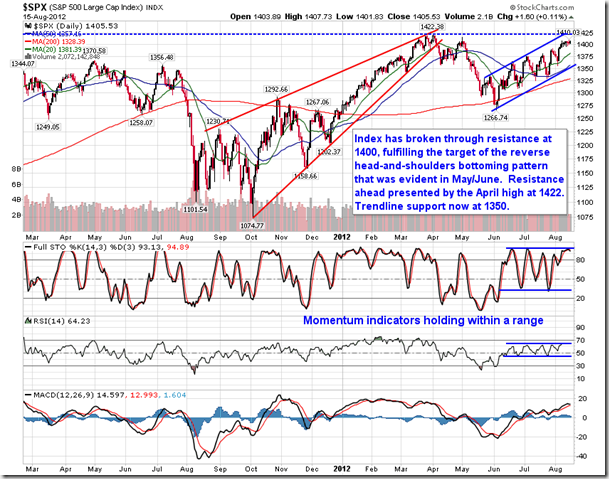
With such low volumes suggesting a severe lack of conviction to equities, hints of a market top can be implied. Tops are a process that typically do not happen overnight; rarely will you see a market stop on a dime at a peak and head sustainably lower. Looking at the past two significant peaks during the recovery rally from the March 2009 low, it took the market approximately 5 and a half months for each peak to mature before equity indices began breaking through levels of support. The trade over these timeframes was both positive and negative, but, at the end of the period, flat returns were the result, leading to investor frustration and a selloff below the 5-month trading range. Looking more broadly, a trading pattern has become evident. Since the March 2009 low, the market has trended positive for 7 to 8 months, followed by a 5 and half month topping process, and eventually resulting in a swift short-term decline. The pattern repeats from the conclusion of the swift market plunge, on of which was realized in June 2010 (10% correction) and the other in August 2011 (20% correction). Assuming that the market began a toping process in the middle of March of this year as indices were charting new highs, the end point to the 5 and a half month range is now upon us (between the end of August and the beginning of September). Markets trended positive following last August’s plunge for a period of seven months into the March highs, leading into a peak that has effectively has resulted in flat return between then and now. If the pattern continues a very swift plunge could soon be realized, potentiality taking equity markets out of the positive trend that has remained intact since the beginning of June.
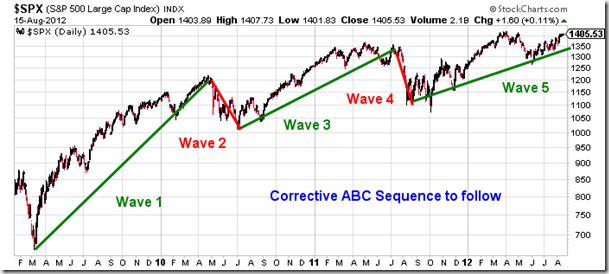
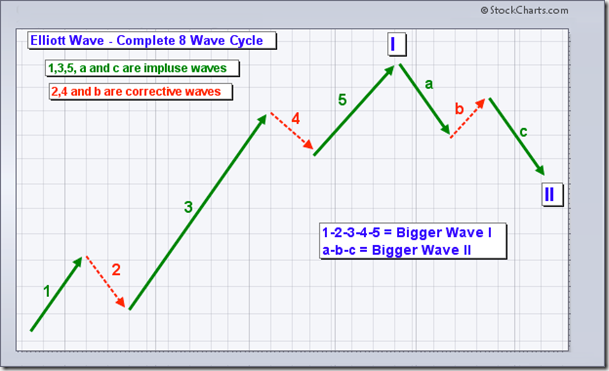
Also, for Elliott Wave theorists out there, equity benchmarks, such as the S&P 500, are within wave 5 of a basic 5-wave impulse sequence from the March ‘09 low. This implies that an ABC corrective sequence lies ahead of us, which could potentially drag equities significantly lower. To read the basics of Elliott Wave Theory from StockCharts.com, visit the following link: http://stockcharts.com/school/doku.php?id=chart_school:market_analysis:elliott_wave_theory.
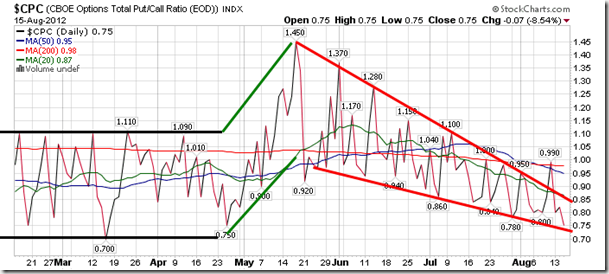
Sentiment on Wednesday, as gauged by the put-call ratio, ended bullish at 0.75. This is one of the lowest put-call ratios this year, beat by the middle of March low of 0.70, which was also around the time of the equity market peak thus far for 2012. Complacent activity, such as this, has been notorious for preceding market tops, suggesting that Sell signals may soon be ahead of us.
Chart Courtesy of StockCharts.com
Chart Courtesy of StockCharts.com
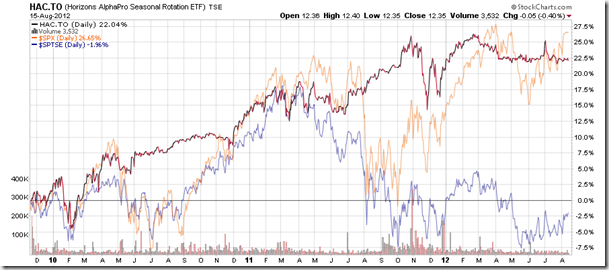
Horizons Seasonal Rotation ETF (TSX:HAC)
- Closing Market Value: $12.35 (down 0.40%)
- Closing NAV/Unit: $12.37 (down 0.01%)
Performance*
| 2012 Year-to-Date | Since Inception (Nov 19, 2009) | |
| HAC.TO | 1.56% | 23.7% |
* performance calculated on Closing NAV/Unit as provided by custodian
Click Here to learn more about the proprietary, seasonal rotation investment strategy developed by research analysts Don Vialoux, Brooke Thackray, and Jon Vialoux.


