by Don Vialoux, EquityClock.com
Upcoming US Events for Today:
- No Significant Events Scheduled
Upcoming International Events for Today:
- The Bank of Japan releases the Minutes from its July meeting at 7:50pm EST.

The Markets
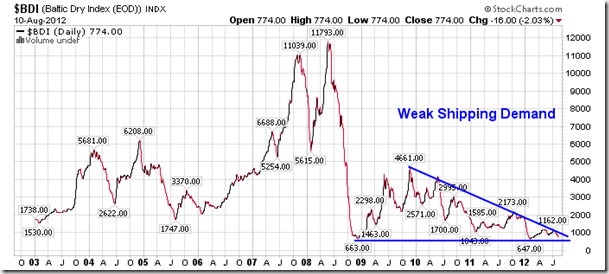
Markets in the US ended positive on Friday, despite concerning signs of economic contraction with China posting a disappointingly low trade surplus number for the month of July. Investors were expecting a surplus of $33.0B, up from the $31.7B reported previous, but the actual was a mere $25.2B. A shockingly low increase in exports at only 1.0%, off from the 8.8% analyst expectation, was the predominant factor behind the weak headline number, which is being pinched primarily by slowing demand from Europe. According to Econoday.com, “this was their worst performance for a non-holiday month since November 2009.” The impact of slowing exports from China is being picked up in the Baltic Dry Index (BDI), which tracks the price to ship freight over the world’s oceans. The BDI is once again pushing towards the lows of the year, signaling that economic fundamentals remain severely depressed. This is typically a leading indicator to equity market weakness.
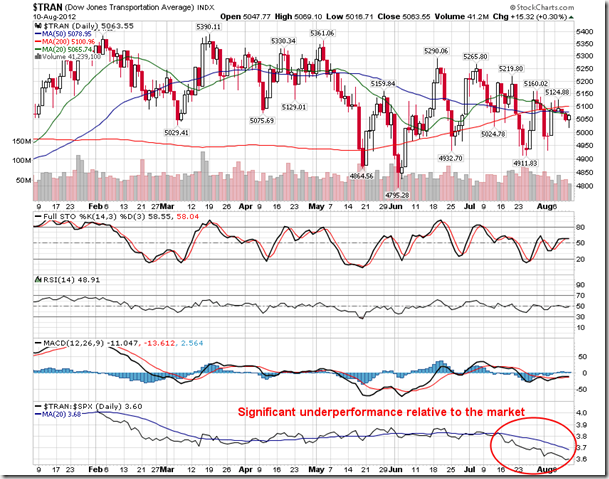
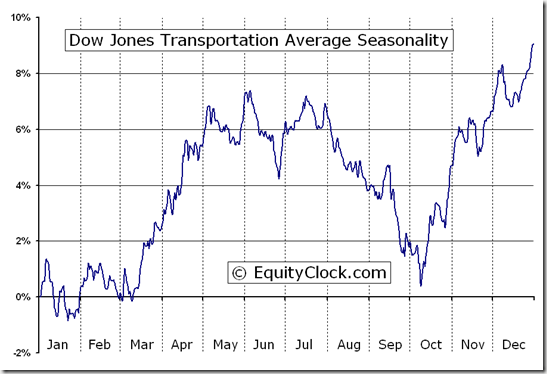
The Baltic Dry Index is not the only shipping gauge that is under pressure. The Dow Transportation Index has been significantly underperforming the market for almost a month, hinting of weak demand for goods. The Dow Transports typically confirm broad market equity moves, leading markets higher when economic fundamentals are strong, and leading the markets lower when fundamentals are weak. The fact that this cyclical industry, Transportation, is not showing the same upside momentum as what the broad market showing is a significant concern. Higher oil prices are also pressuring transportation stocks, a situation which is seasonally typical into September and October.
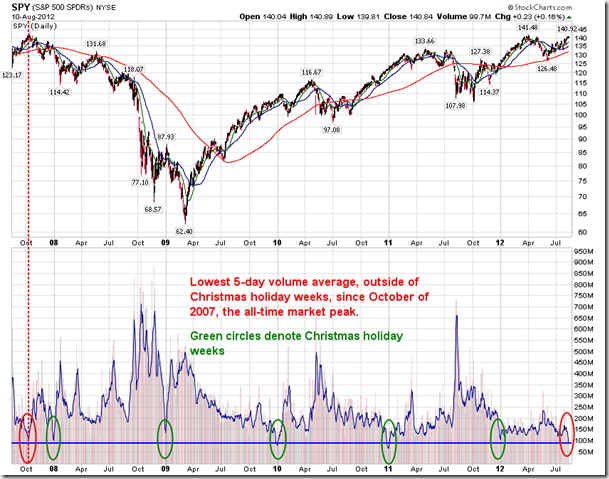
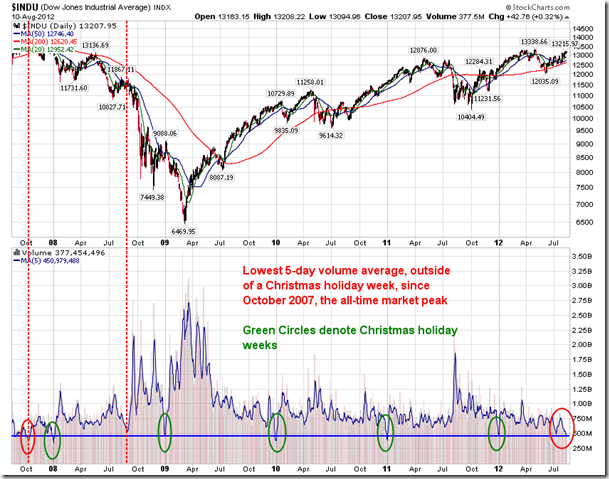
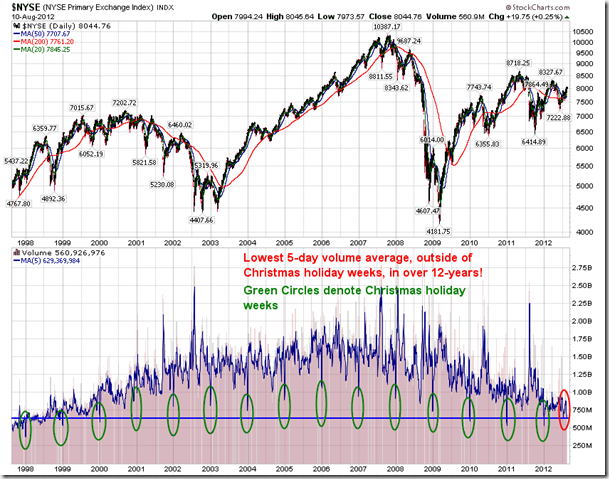
Turning to the equity markets, last week saw the lowest equity market volumes for a non-Christmas holiday week in years. The S&P 500 ETF (SPY) was shown on Friday with a 4-day volume moving average. The fifth day, Friday, only weakened the average further. The Dow Jones Industrial Average is also showing a similar volume profile to SPY. Now take a look at the NYSE Primary Exchange Index, which showed the lowest 5-day volume average since the 1990’s. Low volume implies low conviction, often a precursor to market declines. Volumes are typically lower than average during the summer months, albeit not as low as present levels, picking up once again in September as traders return to their desks from summer vacation. As a result, September and October are known to be the most volatile months on the calendar as regular trading resumes.
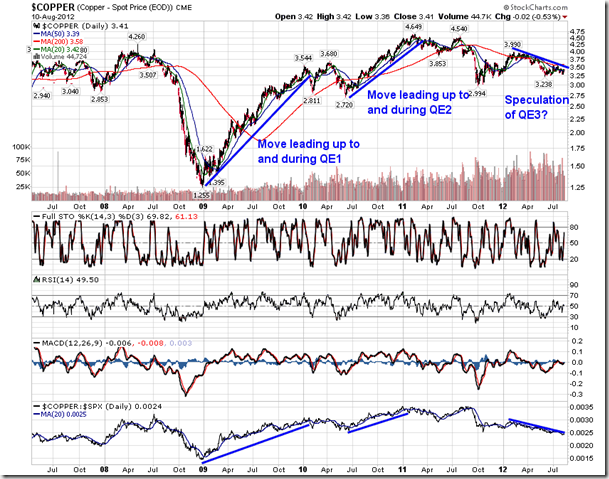
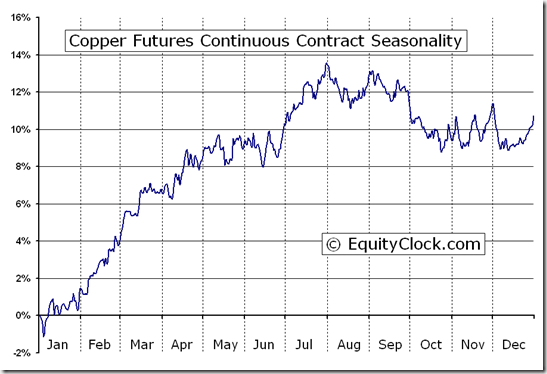
Concerning activity remains evident in the price of Copper, often referred to as “Doctor Copper” due to its ability to predict broad market moves. Copper has maintained a long-term declining path over the past year, underperforming the market in the process. With expectations of further monetary stimulus overriding economic fundamentals, it would be expected that copper would react positively as well, producing positive results and outperforming the market before central bank officials confirm activity, similar to what occurred prior to the last two QE programs. Investors in the cyclical metal are showing signs of skepticism toward the prominent stimulus expectations, perhaps warning that fundamental concerns are still too serious to ignore. Copper seasonally declines between August and October due to economic factors, such as weak manufacturing demand.
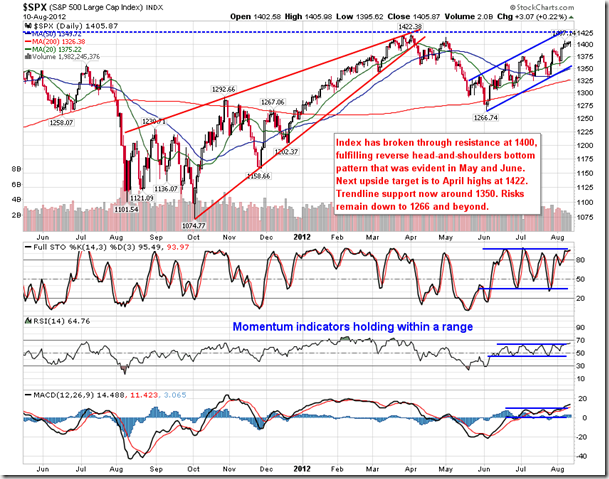
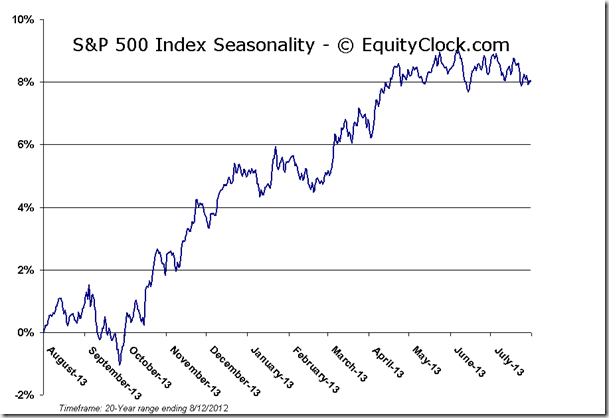
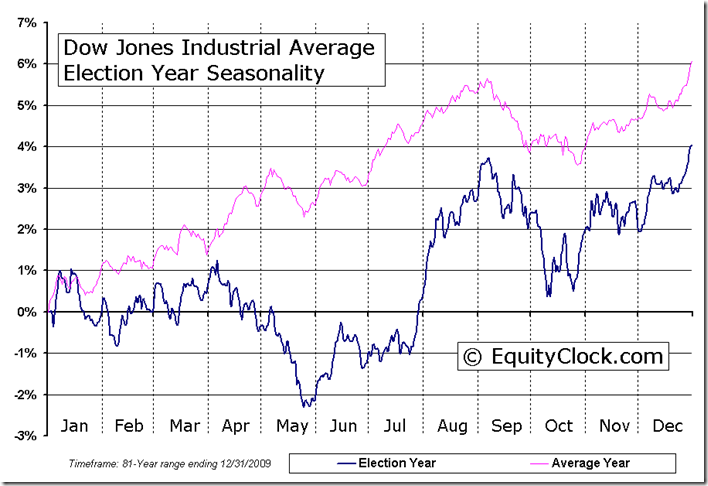
Despite a number of warning signals that remain intact, bullish characteristics are prevailing within the price action of equity markets. The S&P 500 continues to maintain a trend of higher-highs and higher-lows following a June low. Significant moving averages (20, 50, and 200-day) are curling positive. Even bond prices are showing signs of coming under pressure, a positive for equity markets. Sell signals for broad market indices have yet to be confirmed, so although risks are increasing, maintaining appropriate allocations to equities appears prudent until technical indicators roll over. Seasonal tendencies for Presidential election years turn negative into September, so equities are within a window where a peak could be realized at any time. Be prepare to react accordingly.
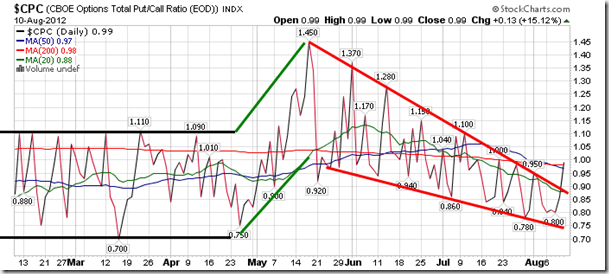
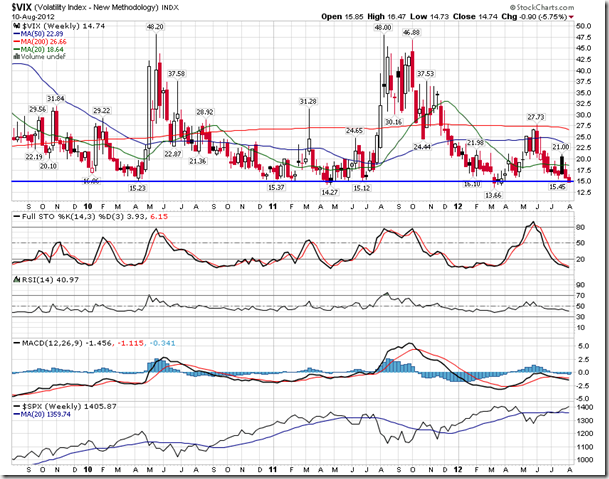
Sentiment on Friday, as gauged by the put-call ratio, ended neutral at 0.99. The ratio broke out of a falling wedge pattern, which could be the precursor to elevated levels of volatility. The VIX has fallen back to levels where the market has been known to correct as complacency reaches extremes. Volatility remains seasonally positive through to October.
Chart Courtesy of StockCharts.com
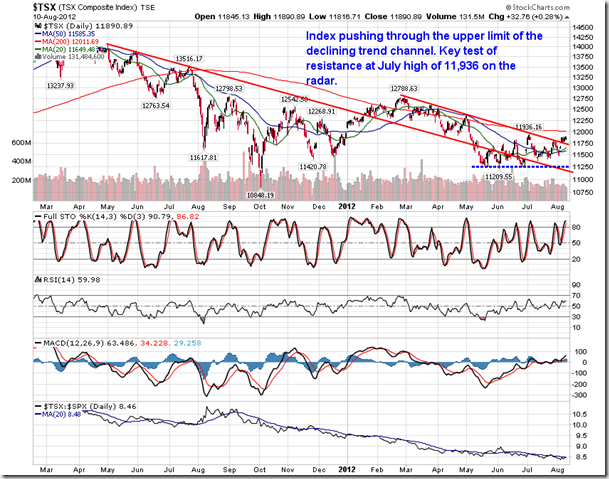
Chart Courtesy of StockCharts.com
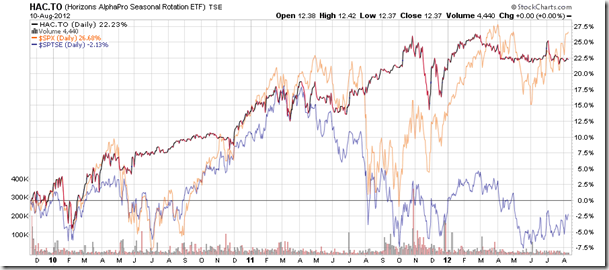
Horizons Seasonal Rotation ETF (TSX:HAC)
- Closing Market Value: $12.37 (unchanged)
- Closing NAV/Unit: $12.39 (unchanged)
Performance*
| 2012 Year-to-Date | Since Inception (Nov 19, 2009) | |
| HAC.TO | 1.72% | 23.9% |
* performance calculated on Closing NAV/Unit as provided by custodian
Click Here to learn more about the proprietary, seasonal rotation investment strategy developed by research analysts Don Vialoux, Brooke Thackray, and Jon Vialoux.


