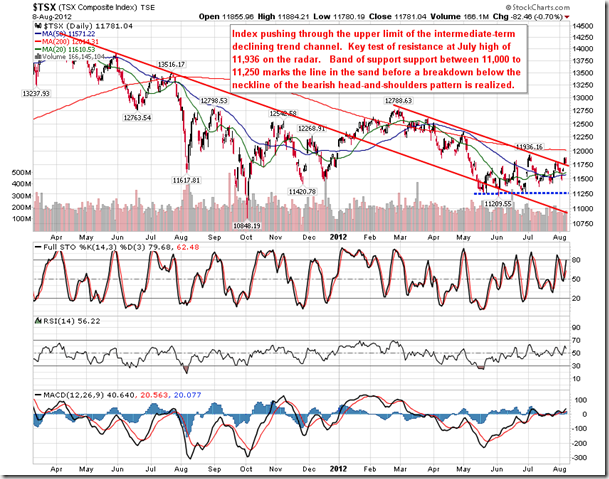
by Don Vialoux, EquityClock.com
Upcoming US Events for Today:
- Weekly Jobless Claims will be released at 8:30am. The market expects Initial Claims to show 375K versus 365K previous. Continuing Claims are expected to reveal 3290K versus 3272K previous.
- Trade Balance for June will be released at 8:30am. The market expects -$47.5B versus -$48.7B previous.
- Wholesale Inventories for June will be released at 10:00am. The market expects an increase of 0.3%, consistent with the increase reported previous.
Upcoming International Events for Today:
- The ECB Publishes the August Monthly Report at 4:00am EST.
- Great Britain Merchandise Trade for June will be released at 4:30am EST. The market expects –9.0B versus –8.4B previous.
- Canadian Housing Starts for July will be released at 8:15am EST. The market expects 210K versus 222.7K previous
- Canadian Trade Balance for June will be released at 8:30am EST. The market expects -$0.9B versus -$0.79B previous.
The Markets
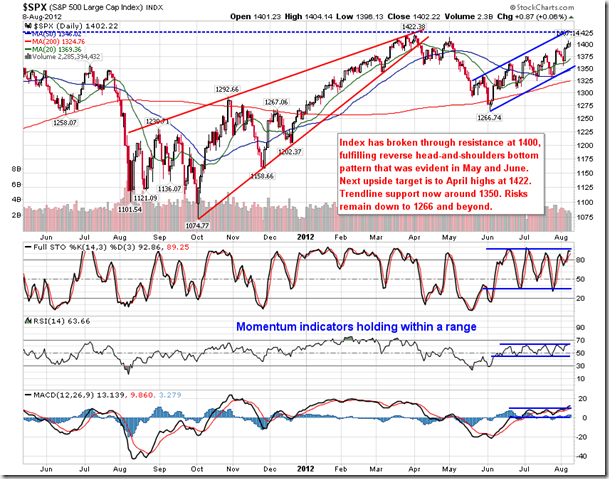
Equity markets traded flat on Wednesday with little to move the tape one way or the other. Volume was once again light as conviction appeared lacking. The two consumer sectors bookended the days activity with Consumer Staples showing the best sector performance with a gain of seven-tenths of a percent, while Consumer Discretionary showed the worst performance, succumbing to a loss of half a percent.
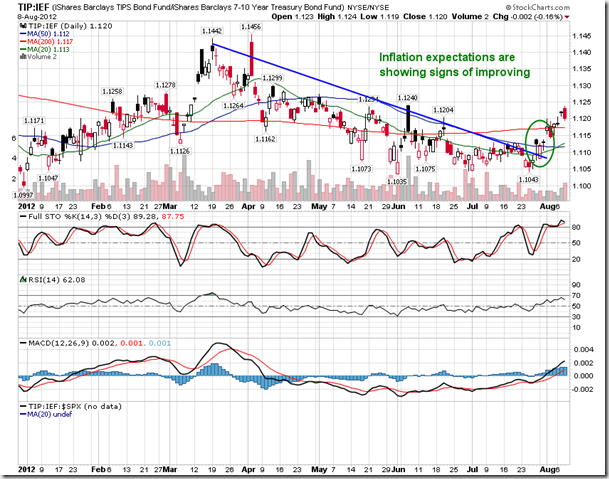
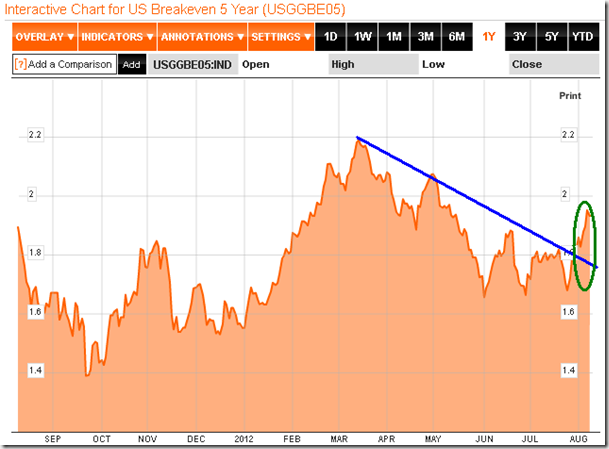
Investors continue to remain hopeful for further monetary stimulus from any one of the major central banks, a fact which is clearly showing up in inflation expectations. The ratio of the Treasury Inflation Protected ETF (TIP) over the 7-10 Year Treasury ETF (IEF) continues to trend higher following an almost five month decline. Even the 5 Year Breakeven Rate has pushed higher since ECB President Mario Draghi hinted of further central bank intervention. Increased inflation expectations are bullish for stocks and commodities, both of which are at multi-month highs.
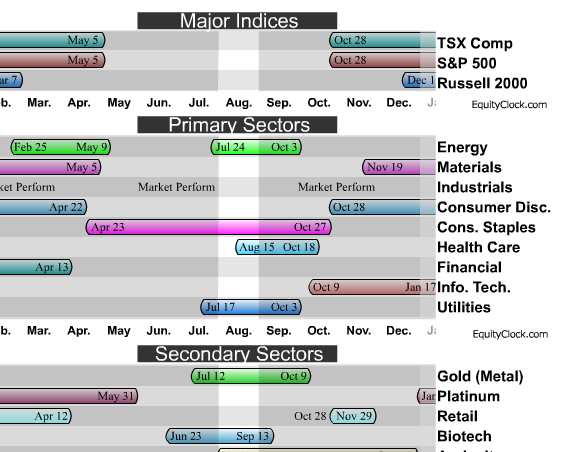
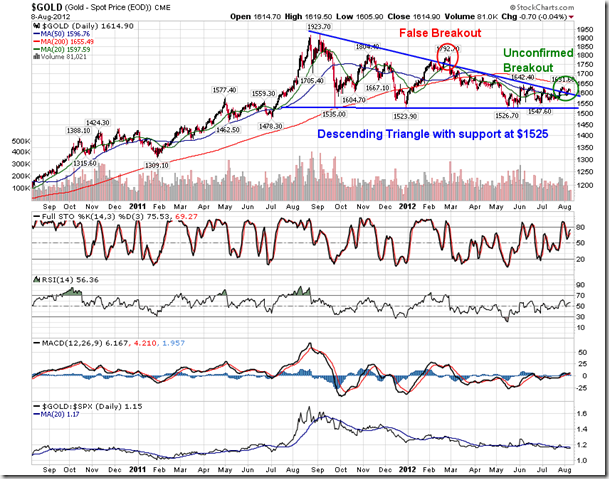
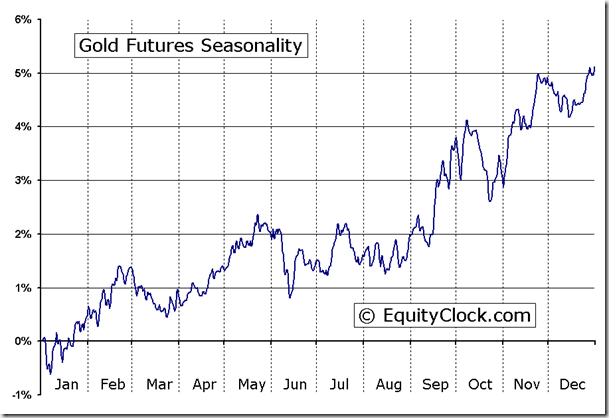
Inflation is particularly conducive to strength in the price of Gold, which has shown moderate improvement over recent weeks. Seasonal investors are well aware that we are within the period of seasonal strength for the yellow metal, but thus far the price action of bullion has been rather subdued, at least compared to years past. The metal is hinting of a breakout above a descending triangle pattern, a pattern that has bearish implications should the price of Gold fall below $1525. Further evidence is required to confirm the breakout. Hesitation from investors to believe in the stimulus hype is suspected to be culprit for the shallow returns.
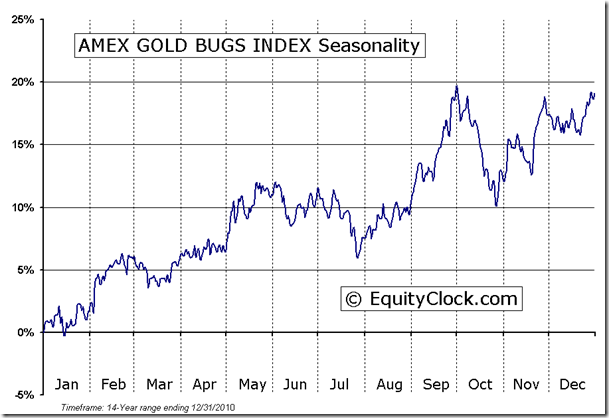
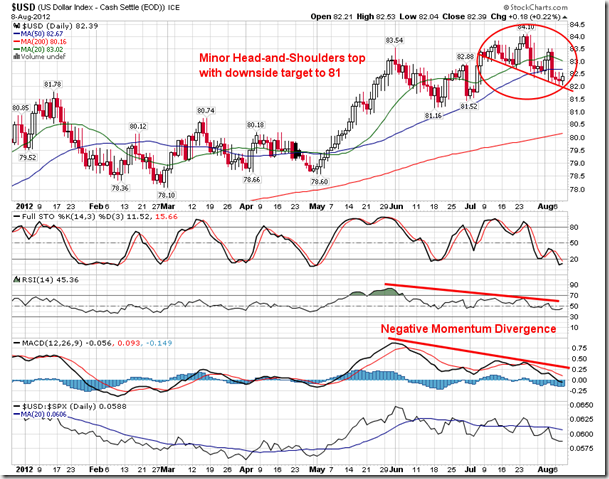
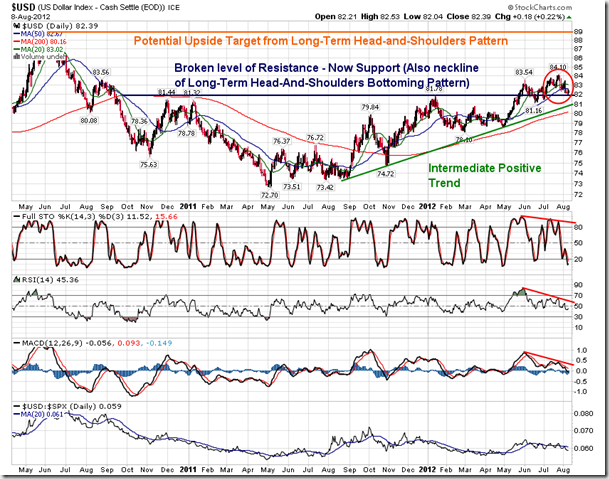
The framework for a strong move higher in Gold has become established. In addition to increased inflation expectations, the US Dollar index has also come under pressure over the course of the past month and a minor head-and-shoulders top can be spotted on the charts. The target of this topping pattern points down to 81, also the point at which the price action would intersect with the rising intermediate trendline. The long-term trend for the US Dollar continues to look positive as the upside target derived from a head-and-shoulder bottoming pattern is fulfilled. The US Dollar Index seasonally declines, on average, between now and September, supporting commodity prices, such as Gold.
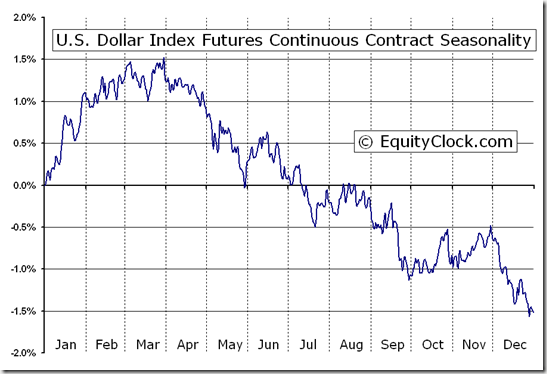
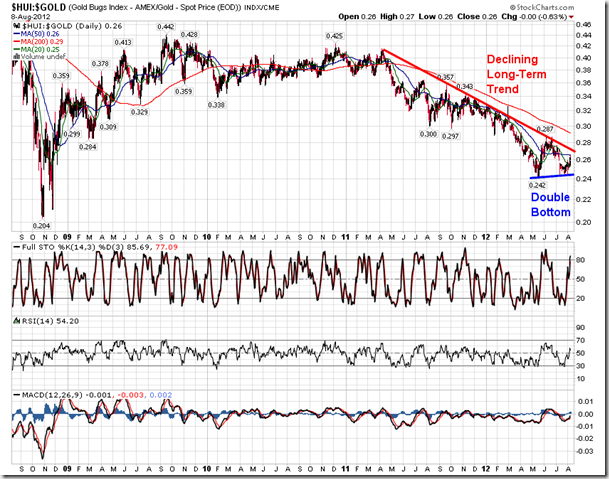
Another positive for the Gold trade is the fact that the miners have recently shown outperformance compared to bullion, a typical precursor to a positive move in the commodity. The relative performance chart for Gold Miners versus Gold bullion has shown a declining trend for over a year and a half, just recently charting the lowest level since the 2008 low. However, a double bottom has become apparent on the chart, hinting of positive things to come as investors become content with equity valuations at current gold prices. A positive trend still needs to be established, which may not be able to be confirmed until the ratio breaks above the 200-day moving average (0.29 on the chart below). The seasonal trade in gold currently looks appealing given the positive backdrop, but keep in mind that the trade could easily break if stimulus expectations are not confirmed.
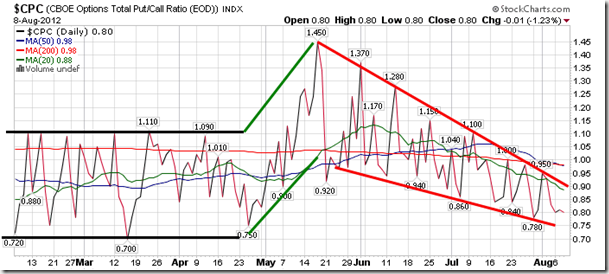
Sentiment on Wednesday, as gauged by the put-call ratio, ended bullish at 0.80. The ratio continues to hold within a declining range as bullish expectations flourish.
Chart Courtesy of StockCharts.com
Chart Courtesy of StockCharts.com
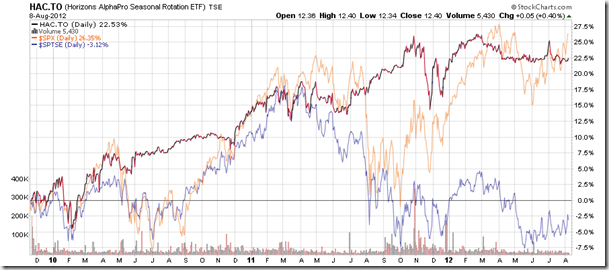
Horizons Seasonal Rotation ETF (TSX:HAC)
- Closing Market Value: $12.40 (up 0.40%)
- Closing NAV/Unit: $12.36 (down 0.02%)
Click Here to learn more about the proprietary, seasonal rotation investment strategy developed by research analysts Don Vialoux, Brooke Thackray, and Jon Vialoux.


